PROTECTED SOURCE SCRIPT
随机检验–波动率切换策略(表格版)
随机检验 – 波动率切换策略(表格版)
模型原理
本指标基于统计学与波动率研究方法,结合多周期(15m / 1h / 4h)的市场数据,构建出一个“趋势-震荡”状态切换的分析框架。
核心思想:
通过 成交量加权的随机检验(coin test) 判断趋势方向及强弱;
使用 布林带带宽(Bandwidth)与方差比率(Variance Ratio) 识别波动收敛与扩张;
引入 贝叶斯统计(Beta 后验分布) 构造上涨概率背景,并对冲单一频段噪声;
在 布林视角与箱体视角 下生成右侧概率评分,最终融合多源概率形成市场状态评估。
关键假设
市场价格在短期内可视为“抛硬币检验”的结果,上涨/下跌概率并非完全均等,而是受成交量加权影响;
波动率在收敛后往往伴随趋势突破,布林带带宽可作为先行指标;
1h 周期的贝叶斯后验概率能够提供稳健的背景多空倾向;
多周期之间的关系符合“主判(1h)→承接(4h/15m)”的层级逻辑。
输出与功能
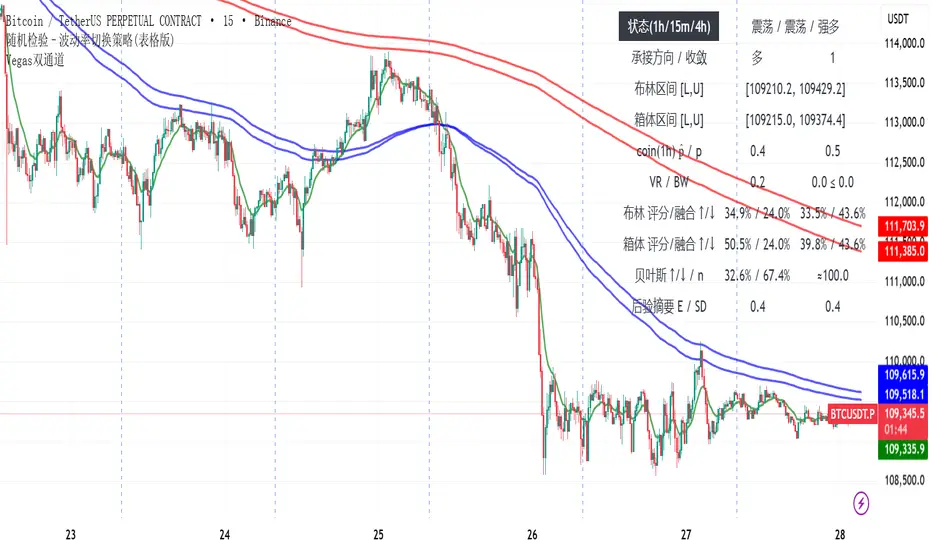
在图表右侧显示表格化仪表盘:
趋势状态(1h / 15m / 4h)
布林/箱体区间与收敛信号
各视角下的概率评分与融合结果
贝叶斯多空概率与后验分布摘要(E、SD、有效样本量)
同时绘制 1h 布林带,直观观察波动结构。
使用说明
该指标为 辅助决策工具,不直接生成交易信号。用户应结合自身策略和风险控制使用。
该版本为公开的测试版本。
Randomized Test – Volatility Switching Strategy (Dashboard Version)
Model Principle
This indicator is built on statistical and volatility analysis methods, combining multi-timeframe market data (15m / 1h / 4h) to construct a framework for switching between “trend” and “range” states.
Core ideas:
Use a volume-weighted randomized test (coin test) to determine trend direction and strength;
Apply Bollinger Bandwidth (BW) and Variance Ratio (VR) to detect volatility contraction and expansion;
Introduce Bayesian statistics (Beta posterior distribution) to build the bullish probability background and reduce single-frequency noise;
Generate right-side probability scores under both Bollinger view and Box view, and fuse them into a comprehensive market state evaluation.
Key Assumptions
In the short term, market prices can be modeled as outcomes of a “coin test,” where up/down probabilities are not perfectly equal but weighted by volume;
After volatility contraction, markets often break into trends, and Bollinger Bandwidth serves as a leading indicator;
The 1h Bayesian posterior probability provides a stable background bias for bullish/bearish tendencies;
Multi-timeframe relationships follow a hierarchical logic: main judgment (1h) → confirmation (4h/15m).
Outputs and Features
A dashboard-style table displayed on the right side of the chart, including:
Trend states (1h / 15m / 4h)
Bollinger/Box ranges and convergence signals
Probability scores and fusion results from different perspectives
Bayesian bullish probability and posterior summary (E, SD, effective sample size)
Visualization of the 1h Bollinger Bands for direct observation of volatility structure.
Usage
This indicator is an auxiliary decision-making tool. It does not generate trading signals directly. Users should apply it in combination with their own strategies and risk management.
This version is released as a public test version.
模型原理
本指标基于统计学与波动率研究方法,结合多周期(15m / 1h / 4h)的市场数据,构建出一个“趋势-震荡”状态切换的分析框架。
核心思想:
通过 成交量加权的随机检验(coin test) 判断趋势方向及强弱;
使用 布林带带宽(Bandwidth)与方差比率(Variance Ratio) 识别波动收敛与扩张;
引入 贝叶斯统计(Beta 后验分布) 构造上涨概率背景,并对冲单一频段噪声;
在 布林视角与箱体视角 下生成右侧概率评分,最终融合多源概率形成市场状态评估。
关键假设
市场价格在短期内可视为“抛硬币检验”的结果,上涨/下跌概率并非完全均等,而是受成交量加权影响;
波动率在收敛后往往伴随趋势突破,布林带带宽可作为先行指标;
1h 周期的贝叶斯后验概率能够提供稳健的背景多空倾向;
多周期之间的关系符合“主判(1h)→承接(4h/15m)”的层级逻辑。
输出与功能
在图表右侧显示表格化仪表盘:
趋势状态(1h / 15m / 4h)
布林/箱体区间与收敛信号
各视角下的概率评分与融合结果
贝叶斯多空概率与后验分布摘要(E、SD、有效样本量)
同时绘制 1h 布林带,直观观察波动结构。
使用说明
该指标为 辅助决策工具,不直接生成交易信号。用户应结合自身策略和风险控制使用。
该版本为公开的测试版本。
Randomized Test – Volatility Switching Strategy (Dashboard Version)
Model Principle
This indicator is built on statistical and volatility analysis methods, combining multi-timeframe market data (15m / 1h / 4h) to construct a framework for switching between “trend” and “range” states.
Core ideas:
Use a volume-weighted randomized test (coin test) to determine trend direction and strength;
Apply Bollinger Bandwidth (BW) and Variance Ratio (VR) to detect volatility contraction and expansion;
Introduce Bayesian statistics (Beta posterior distribution) to build the bullish probability background and reduce single-frequency noise;
Generate right-side probability scores under both Bollinger view and Box view, and fuse them into a comprehensive market state evaluation.
Key Assumptions
In the short term, market prices can be modeled as outcomes of a “coin test,” where up/down probabilities are not perfectly equal but weighted by volume;
After volatility contraction, markets often break into trends, and Bollinger Bandwidth serves as a leading indicator;
The 1h Bayesian posterior probability provides a stable background bias for bullish/bearish tendencies;
Multi-timeframe relationships follow a hierarchical logic: main judgment (1h) → confirmation (4h/15m).
Outputs and Features
A dashboard-style table displayed on the right side of the chart, including:
Trend states (1h / 15m / 4h)
Bollinger/Box ranges and convergence signals
Probability scores and fusion results from different perspectives
Bayesian bullish probability and posterior summary (E, SD, effective sample size)
Visualization of the 1h Bollinger Bands for direct observation of volatility structure.
Usage
This indicator is an auxiliary decision-making tool. It does not generate trading signals directly. Users should apply it in combination with their own strategies and risk management.
This version is released as a public test version.
Script protegido
Este script se publica como código cerrado. No obstante, puede utilizarlo libremente y sin ninguna limitación. Obtenga más información aquí.
Exención de responsabilidad
La información y las publicaciones no constituyen, ni deben considerarse como asesoramiento o recomendaciones financieras, de inversión, de trading o de otro tipo proporcionadas o respaldadas por TradingView. Más información en Condiciones de uso.