OPEN-SOURCE SCRIPT
Multi-TimeFrame RSI Divergence
1. Table Usage
The table shows all divergences for each timeframe (5m → 4h).
Columns:
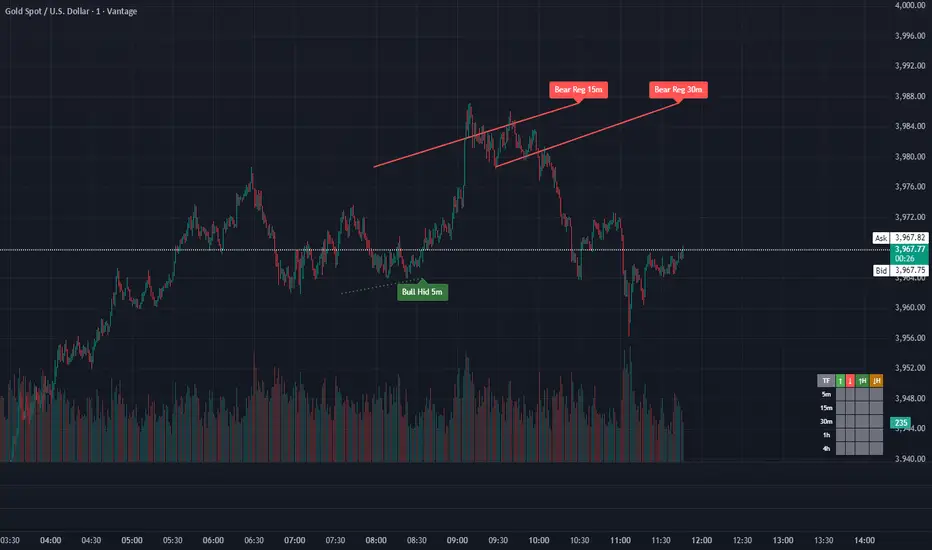
Bull Reg → Regular bullish divergence
Bear Reg → Regular bearish divergence
Bull Hid → Hidden bullish divergence
Bear Hid → Hidden bearish divergence
Movable via inputs: adjust Table X Position (bars from left) and Table Y Position (price level).
Customizable timeframe text color: set via TF Color input.
2. Reading Divergences
Lines on the chart:
Solid green/red = regular divergence
Dotted = hidden divergence
Dashed = RSI side of divergence
Labels appear at the pivot points to indicate type and timeframe.
3. Timeframes
Works on 5m, 15m, 30m, 1h, and 4h.
Each timeframe is independent, so divergences are correctly detected even if higher or lower TFs don’t show anything yet.
4. Adjusting Sensitivity
Pivot Left Bars / Pivot Right Bars → controls how sensitive pivots are.
Lower values = more pivots detected (shorter-term swings).
Higher values = smoother pivots, fewer false signals.
Pivot search lookback → how far back the script searches for pivots.
RSI Length → default is 14, but can be adjusted for faster/slower RSI responsiveness.
5. Line and Label Cleanup
Expire lines/labels after N bars → prevents the chart from cluttering.
Older lines/labels are automatically deleted after this many bars.
6. Practical Tips
Use multiple charts or TradingView layouts: you can run the script on one chart and visually track divergences across TFs without switching.
Combine with support/resistance levels or trend analysis for higher-probability trades.
Watch for hidden divergences on pullbacks → often signal trend continuation.
The table shows all divergences for each timeframe (5m → 4h).
Columns:
Bull Reg → Regular bullish divergence
Bear Reg → Regular bearish divergence
Bull Hid → Hidden bullish divergence
Bear Hid → Hidden bearish divergence
Movable via inputs: adjust Table X Position (bars from left) and Table Y Position (price level).
Customizable timeframe text color: set via TF Color input.
2. Reading Divergences
Lines on the chart:
Solid green/red = regular divergence
Dotted = hidden divergence
Dashed = RSI side of divergence
Labels appear at the pivot points to indicate type and timeframe.
3. Timeframes
Works on 5m, 15m, 30m, 1h, and 4h.
Each timeframe is independent, so divergences are correctly detected even if higher or lower TFs don’t show anything yet.
4. Adjusting Sensitivity
Pivot Left Bars / Pivot Right Bars → controls how sensitive pivots are.
Lower values = more pivots detected (shorter-term swings).
Higher values = smoother pivots, fewer false signals.
Pivot search lookback → how far back the script searches for pivots.
RSI Length → default is 14, but can be adjusted for faster/slower RSI responsiveness.
5. Line and Label Cleanup
Expire lines/labels after N bars → prevents the chart from cluttering.
Older lines/labels are automatically deleted after this many bars.
6. Practical Tips
Use multiple charts or TradingView layouts: you can run the script on one chart and visually track divergences across TFs without switching.
Combine with support/resistance levels or trend analysis for higher-probability trades.
Watch for hidden divergences on pullbacks → often signal trend continuation.
Script de código abierto
Siguiendo fielmente el espíritu de TradingView, el creador de este script lo ha publicado en código abierto, permitiendo que otros traders puedan revisar y verificar su funcionalidad. ¡Enhorabuena al autor! Puede utilizarlo de forma gratuita, pero tenga en cuenta que la publicación de este código está sujeta a nuestras Normas internas.
Exención de responsabilidad
La información y las publicaciones que ofrecemos, no implican ni constituyen un asesoramiento financiero, ni de inversión, trading o cualquier otro tipo de consejo o recomendación emitida o respaldada por TradingView. Puede obtener información adicional en las Condiciones de uso.