OPEN-SOURCE SCRIPT
Actualizado Historical Volatility Bands [Loxx]
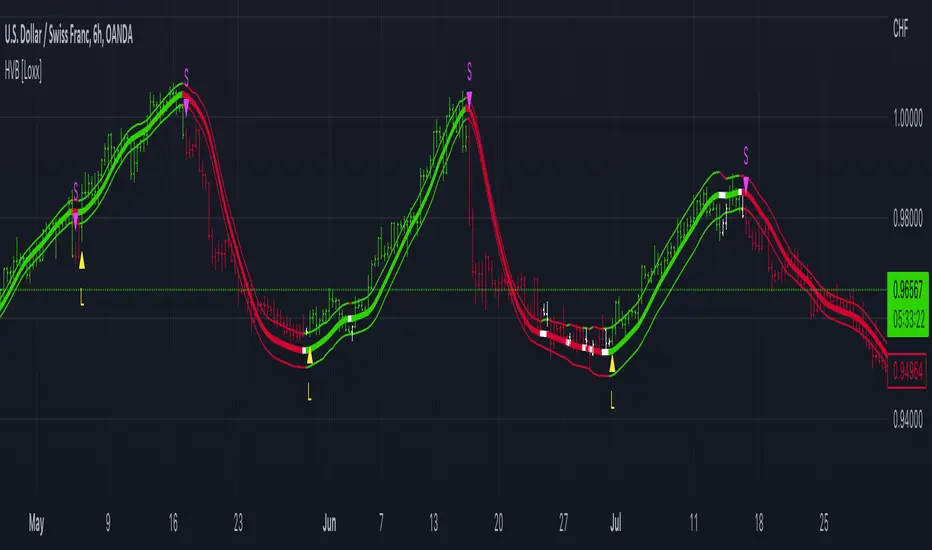
Historical Volatility Bands are constructed using:
What is Historical Volatility?
Historical Volatility (HV) is a statistical measure of the dispersion of returns for a given security or market index over a given period of time. Generally, this measure is calculated by determining the average deviation from the average price of a financial instrument in the given time period. Using standard deviation is the most common, but not the only, way to calculate Historical Volatility.
The higher the Historical Volatility value, the riskier the security. However, that is not necessarily a bad result as risk works both ways - bullish and bearish, i.e: Historical Volatility is not a directional indicator and should not be used as other directional indicators are used. Use to to determine the rising and falling price change volatility.
The color of the middle line, unlike the bands colors, has 3 colors. When colors of the bands are the same, then the middle line has the same color, otherwise it's white.
Included
- Average as the middle line.
- Upper and lower bands using the Historical Volatility for bands calculation.
What is Historical Volatility?
Historical Volatility (HV) is a statistical measure of the dispersion of returns for a given security or market index over a given period of time. Generally, this measure is calculated by determining the average deviation from the average price of a financial instrument in the given time period. Using standard deviation is the most common, but not the only, way to calculate Historical Volatility.
The higher the Historical Volatility value, the riskier the security. However, that is not necessarily a bad result as risk works both ways - bullish and bearish, i.e: Historical Volatility is not a directional indicator and should not be used as other directional indicators are used. Use to to determine the rising and falling price change volatility.
The color of the middle line, unlike the bands colors, has 3 colors. When colors of the bands are the same, then the middle line has the same color, otherwise it's white.
Included
- Alerts
- Signals
- Loxx's Expanded Source Types
- Bar coloring
Notas de prensa
Updated to handle all timeframes and all tickers. Script de código abierto
Fiel al espíritu de TradingView, el creador de este script lo ha convertido en código abierto, para que los traders puedan revisar y verificar su funcionalidad. ¡Enhorabuena al autor! Aunque puede utilizarlo de forma gratuita, recuerde que la republicación del código está sujeta a nuestras Normas internas.
Public Telegram Group, t.me/algxtrading_public
VIP Membership Info: patreon.com/algxtrading/membership
VIP Membership Info: patreon.com/algxtrading/membership
Exención de responsabilidad
La información y las publicaciones no constituyen, ni deben considerarse como asesoramiento o recomendaciones financieras, de inversión, de trading o de otro tipo proporcionadas o respaldadas por TradingView. Más información en Condiciones de uso.
Script de código abierto
Fiel al espíritu de TradingView, el creador de este script lo ha convertido en código abierto, para que los traders puedan revisar y verificar su funcionalidad. ¡Enhorabuena al autor! Aunque puede utilizarlo de forma gratuita, recuerde que la republicación del código está sujeta a nuestras Normas internas.
Public Telegram Group, t.me/algxtrading_public
VIP Membership Info: patreon.com/algxtrading/membership
VIP Membership Info: patreon.com/algxtrading/membership
Exención de responsabilidad
La información y las publicaciones no constituyen, ni deben considerarse como asesoramiento o recomendaciones financieras, de inversión, de trading o de otro tipo proporcionadas o respaldadas por TradingView. Más información en Condiciones de uso.