OPEN-SOURCE SCRIPT
Approx STH Unrealized Profit [Relative %]
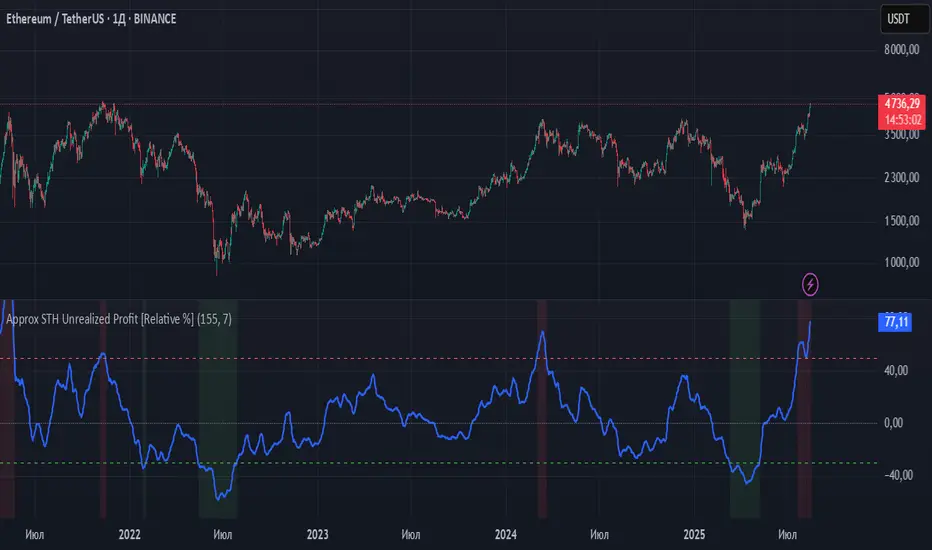
This indicator estimates the unrealized profit or loss of short-term holders (STH) without requiring on-chain data. Instead of using actual STH Realized Price (average purchase price), it employs a 155-day Simple Moving Average (SMA) to approximate the behavior of "recent buyers."
How It Works
The indicator calculates the percentage deviation between the current price and the 155-day SMA using the formula:
(Current Price - 155 SMA) / 155 SMA * 100%.
Positive values indicate profit, while negative values show loss. Key threshold levels are set at +50% (overbought) and -30% (oversold).
Trading Applications
Profit > 50% - STH are experiencing significant profits, suggesting potential correction. Consider taking partial profits.
0% < Profit < 50% - Moderate profits indicate the trend may continue. Maintain positions.
Profit ≈ 0% - Price is near STH's average entry point, showing market indecision.
-30% < Profit < 0% - STH are at a loss, potentially signaling accumulation opportunities.
Profit < -30% - Extreme oversold conditions may present buying opportunities.
Limitations
SMA only approximates STH behavior.
May produce false signals during sideways markets.
SMA lag can be noticeable in strong trending markets.
Recommendation
For improved accuracy, combine this indicator with trend-following tools (200 EMA, Volume analysis) and other technical indicators. It serves best as a supplementary tool for identifying overbought/oversold market conditions within your trading strategy.
Script de código abierto
Siguiendo fielmente el espíritu de TradingView, el creador de este script lo ha publicado en código abierto, permitiendo que otros traders puedan revisar y verificar su funcionalidad. ¡Enhorabuena al autor! Puede utilizarlo de forma gratuita, pero tenga en cuenta que la publicación de este código está sujeta a nuestras Normas internas.
💡 Обсуждаем торговые идеи , делимся индикаторами и стратегиями в нашем Telegram-чате:
👉 t.me/+AQWwxRhhrXI0YTgy
👉 t.me/+AQWwxRhhrXI0YTgy
Exención de responsabilidad
La información y las publicaciones que ofrecemos, no implican ni constituyen un asesoramiento financiero, ni de inversión, trading o cualquier otro tipo de consejo o recomendación emitida o respaldada por TradingView. Puede obtener información adicional en las Condiciones de uso.