OPEN-SOURCE SCRIPT
%Bs
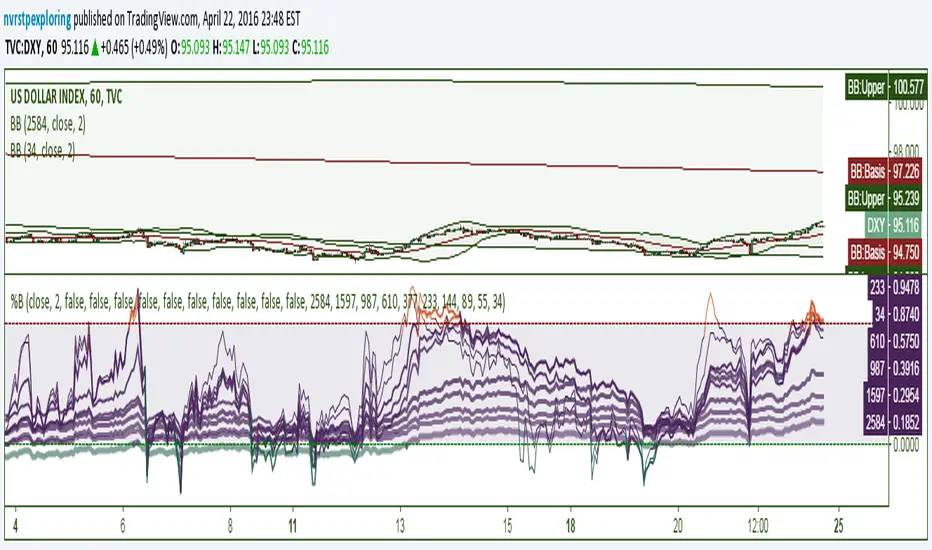
An indicator with 10 configurable %B lines for identifying trends, overbought and oversold conditions, and reversal points. %B is a linear representation of a securities relationship to the Upper and Lower Bollinger Bands. The best opportunities arise when a security is oversold in a bullish trend and overbought in a bearish trend. The longer %B trend-lines in this indicator are very useful for major reversals. They can be used to indicate the high or low of the day on a 1-minute chart or show a multi-year reversal point.
%B = (Current Price - Lower Band) / (Upper Band - Lower Band)
%B = (Current Price - Lower Band) / (Upper Band - Lower Band)
Script de código abierto
Fiel al espíritu de TradingView, el creador de este script lo ha convertido en código abierto, para que los traders puedan revisar y verificar su funcionalidad. ¡Enhorabuena al autor! Aunque puede utilizarlo de forma gratuita, recuerde que la republicación del código está sujeta a nuestras Normas internas.
Exención de responsabilidad
La información y las publicaciones no constituyen, ni deben considerarse como asesoramiento o recomendaciones financieras, de inversión, de trading o de otro tipo proporcionadas o respaldadas por TradingView. Más información en Condiciones de uso.