OPEN-SOURCE SCRIPT
Unsurpassed Close Levels
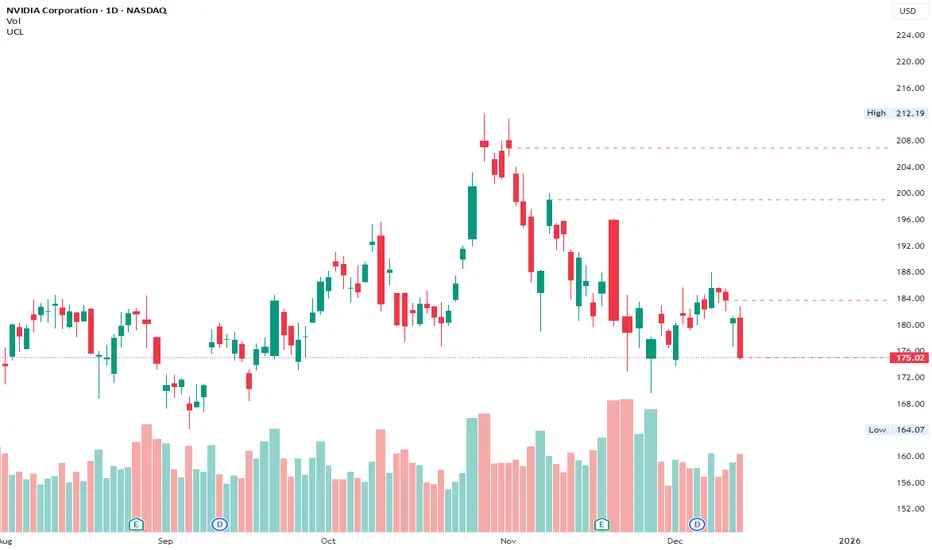
This indicator identifies and visually highlights previous candle close prices that have not yet been surpassed by any subsequent higher high — creating dynamic horizontal resistance levels based purely on closing prices.
How it works:
For every confirmed candle, a dashed horizontal ray is drawn from its close price extending to the right.
The ray remains visible as long as no future candle's high reaches or exceeds that previous close level.
As soon as price makes a new high that touches or surpasses the level, the ray is automatically removed.
Duplicate levels (exact same close price already active) are skipped to keep the chart clean.
A built-in limit of 50 active levels prevents overload on very long timeframes.
Use cases:
Spot potential resistance zones formed by previous closes that price has failed to reclaim on the upside.
Helpful in downtrends or ranging markets to visualize "overhead supply" levels where sellers previously stepped in at the close.
Great complement to traditional swing highs or supply/demand zones — focuses exclusively on close-based resistance.
Works on any timeframe and any instrument.
Visuals:
Dashed red horizontal rays extending right from unsurpassed closes.
Clean and lightweight — lines disappear automatically when invalidated.
Simple, effective, and fully automatic. No inputs required.
Feel free to customize the color, style, or max levels count in the code if desired.
Script de código abierto
Fiel al espíritu de TradingView, el creador de este script lo ha convertido en código abierto, para que los traders puedan revisar y verificar su funcionalidad. ¡Enhorabuena al autor! Aunque puede utilizarlo de forma gratuita, recuerde que la republicación del código está sujeta a nuestras Normas internas.
Exención de responsabilidad
La información y las publicaciones no constituyen, ni deben considerarse como asesoramiento o recomendaciones financieras, de inversión, de trading o de otro tipo proporcionadas o respaldadas por TradingView. Más información en Condiciones de uso.