OPEN-SOURCE SCRIPT
Actualizado Fibonacci Trend Zone

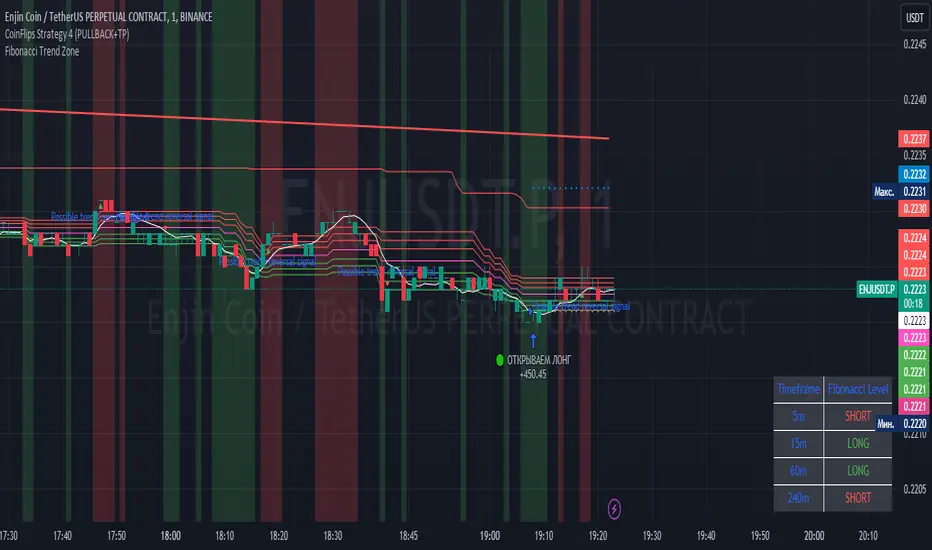
The "Fibonacci Trend Zone" indicator is a supplementary tool that helps identify the current trend based on Fibonacci zones. It utilizes Fibonacci levels (0.62, 0.705, and 0.79) to define long-term trend zones. The green zone indicates potential long trades, while the red zone suggests potential short trades. The indicator also includes the Triple Exponential Moving Average (TEMA), which helps confirm trend reversals. When the TEMA crosses the Fibonacci level of 0.5, it may signal a possible trend reversal. Use this indicator in conjunction with your primary trading strategy to make more informed trading decisions. Additionally, the indicator provides flexibility in customizing the styles, allowing you to change the color scheme or disable the display of certain elements to suit your preferences and requirements.
Индикатор "Fibonacci Trend Zone" является вспомогательным инструментом, который помогает определить текущий тренд на основе зон фибоначчи. Он использует уровни фибоначчи (0,62, 0,705 и 0,79) для определения зон долгосрочного тренда. Зеленая зона указывает на возможность лонг-сделок, а красная зона - на возможность шорт-сделок. Индикатор также включает Triple Exponential Moving Average (TEMA), который помогает подтвердить смену тренда. Когда TEMA пересекает уровень фибоначчи 0,5, это может сигнализировать о возможной смене тренда. Используйте данный индикатор в сочетании с вашей основной торговой стратегией для принятия более информированных решений. Индикатор также предоставляет гибкость в настройке стилей, позволяя вам изменить цветовую схему или отключить отображение некоторых элементов, чтобы соответствовать вашим предпочтениям и требованиям.
Индикатор "Fibonacci Trend Zone" является вспомогательным инструментом, который помогает определить текущий тренд на основе зон фибоначчи. Он использует уровни фибоначчи (0,62, 0,705 и 0,79) для определения зон долгосрочного тренда. Зеленая зона указывает на возможность лонг-сделок, а красная зона - на возможность шорт-сделок. Индикатор также включает Triple Exponential Moving Average (TEMA), который помогает подтвердить смену тренда. Когда TEMA пересекает уровень фибоначчи 0,5, это может сигнализировать о возможной смене тренда. Используйте данный индикатор в сочетании с вашей основной торговой стратегией для принятия более информированных решений. Индикатор также предоставляет гибкость в настройке стилей, позволяя вам изменить цветовую схему или отключить отображение некоторых элементов, чтобы соответствовать вашим предпочтениям и требованиям.
Notas de prensa
In this indicator update, a table has been added, which is displayed in the bottom-right corner of the chart. The table shows Fibonacci levels for different timeframes (5 minutes, 15 minutes, 60 minutes, and 240 minutes). If the table indicates "SHORT," it means that short positions are preferable, and if it indicates "LONG," it means that long positions are preferable.It is important to note that this indicator is not a standalone trading tool but serves as a complement to your primary trading strategy. For example, if you are using a strategy based on smart money or order blocks, it is recommended to avoid opening long positions when you are in the "SHORT" zone, and vice versa.
When using this indicator, it is recommended to remove price scale labels and status bar values in your style settings. Additionally, you can disable vertical shading up to the 0.79 level to enhance visualization and focus on the key Fibonacci levels.
-----
В этом обновлении индикатора была добавлена таблица, которая отображается в правом нижнем углу графика. Таблица показывает уровни Фибоначчи для разных таймфреймов (5 минут, 15 минут, 60 минут и 240 минут). Если в таблице указано "SHORT", это означает, что предпочтительными являются короткие позиции, а если указано "LONG", то предпочтительными являются длинные позиции.
Важно отметить, что данный индикатор не является самостоятельным торговым инструментом, а служит дополнением к вашей основной торговой стратегии. Например, если вы используете стратегию, основанную на смартмани ордер блоках, рекомендуется избегать открытия длинных позиций, если находитесь в зоне "SHORT", и наоборот.
При использовании этого индикатора в своих настройках стиля рекомендуется убрать метки на ценовой шкале и значения в строке статуса. Также можно отключить вертикальные закрашивания до уровня 0.79, чтобы облегчить визуализацию и фокусировку на главных уровнях Фибоначчи.
Notas de prensa
Added display of zone 0.62 0.705 and notifications for any of the levels.Script de código abierto
Fiel al espíritu de TradingView, el creador de este script lo ha convertido en código abierto, para que los traders puedan revisar y verificar su funcionalidad. ¡Enhorabuena al autor! Aunque puede utilizarlo de forma gratuita, recuerde que la republicación del código está sujeta a nuestras Normas internas.
🔥 Умный трейдинг с Coin Flips!
📈 Авторские разборы рынка и стратегии
📩 Подписывайся на наш тг канал: t.me/+P-THpv31_Yk1YjAy
⚡️ Без випок и платных подписок
🛠️ Бесплатные индикаторы и боты для тг → t.me/SUBSCRIPTION_coinflips_bot
📈 Авторские разборы рынка и стратегии
📩 Подписывайся на наш тг канал: t.me/+P-THpv31_Yk1YjAy
⚡️ Без випок и платных подписок
🛠️ Бесплатные индикаторы и боты для тг → t.me/SUBSCRIPTION_coinflips_bot
Exención de responsabilidad
La información y las publicaciones no constituyen, ni deben considerarse como asesoramiento o recomendaciones financieras, de inversión, de trading o de otro tipo proporcionadas o respaldadas por TradingView. Más información en Condiciones de uso.
Script de código abierto
Fiel al espíritu de TradingView, el creador de este script lo ha convertido en código abierto, para que los traders puedan revisar y verificar su funcionalidad. ¡Enhorabuena al autor! Aunque puede utilizarlo de forma gratuita, recuerde que la republicación del código está sujeta a nuestras Normas internas.
🔥 Умный трейдинг с Coin Flips!
📈 Авторские разборы рынка и стратегии
📩 Подписывайся на наш тг канал: t.me/+P-THpv31_Yk1YjAy
⚡️ Без випок и платных подписок
🛠️ Бесплатные индикаторы и боты для тг → t.me/SUBSCRIPTION_coinflips_bot
📈 Авторские разборы рынка и стратегии
📩 Подписывайся на наш тг канал: t.me/+P-THpv31_Yk1YjAy
⚡️ Без випок и платных подписок
🛠️ Бесплатные индикаторы и боты для тг → t.me/SUBSCRIPTION_coinflips_bot
Exención de responsabilidad
La información y las publicaciones no constituyen, ni deben considerarse como asesoramiento o recomendaciones financieras, de inversión, de trading o de otro tipo proporcionadas o respaldadas por TradingView. Más información en Condiciones de uso.