OPEN-SOURCE SCRIPT
Trend Analyzer MACD Enhanced
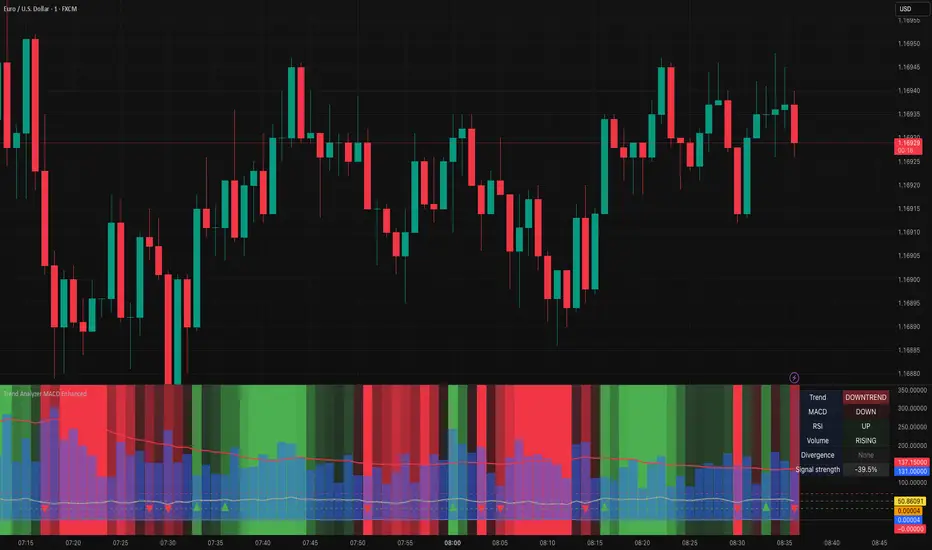
Trend Analyzer MACD Enhanced
Advanced trend analysis with MACD, RSI, Volume and Divergence detection!
Overview
This comprehensive indicator combines multiple technical analysis tools into one powerful visualization. It features dynamic background coloring, real-time signal strength calculation, and automatic divergence detection for complete market analysis.
Key Features
✅ Multi-Indicator Analysis- MACD, RSI, and Volume in one indicator
✅ Divergence Detection - Automatic bullish and bearish divergence identification
✅ Dynamic Background - Color-coded trend zones with smooth transitions
✅ Signal Strength - Weighted calculation showing overall market sentiment (0-100%)
✅ Trend Change Detection - Visual markers for trend reversals
✅ Information Table - Real-time status of all indicators
How It Works
The indicator calculates signal strength using weighted analysis:
- MACD (50%) - Primary trend momentum
- RSI (30%) - Overbought/oversold conditions
- Volume (20%) - Volume confirmation
Signal Strength Range: -100% to +100%
Visual Elements
Background Colors:
- 🟢 **Green** - Uptrend (intensity based on signal strength)
- 🔴 **Red** - Downtrend (intensity based on signal strength)
- ⚪ **Gray** - Neutral/sideways market
Trend Markers:
- 🔺 **Green Triangle Up** - Start of new uptrend
- 🔻 **Red Triangle Down** - Start of new downtrend
- 📏 **Vertical Lines** - Trend change confirmation
Information Table
Real-time display showing:
- Trend - Current trend state with color coding
- MACD - Direction and crossover status
- RSI - Level and overbought/oversold status
- Volume - Level and trend direction
- Divergence - Current divergence status
- Signal Strength- Overall percentage
Alerts
Built-in alerts for:
- Strong Buy/Sell Signals - High probability setups
- Divergence Signals - Early reversal warnings
Settings
MACD:Fast (12), Slow (26), Signal (9)
RSI:Length (14), Overbought (70), Oversold (30)
Volume:MA Length (20), Threshold (1.5x)
Display:Toggle RSI, Volume, and Table visibility
Best Practices
🎯 Works best in trending markets
📊 Use in separate window below main chart
⚡ Combine with price action analysis
🛡️ Always use proper risk management
Pro Tips
- Green background = Strong uptrend, Red background = Strong downtrend
- Signal strength > 50% = Very bullish, < -50% = Very bearish
- Watch for divergence signals for early reversal warnings
- Use the information table for quick market assessment
---
Created with ❤️ for the trading community
This indicator is free to use for both commercial and non-commercial purposes.
Script de código abierto
Fiel al espíritu de TradingView, el creador de este script lo ha convertido en código abierto, para que los traders puedan revisar y verificar su funcionalidad. ¡Enhorabuena al autor! Aunque puede utilizarlo de forma gratuita, recuerde que la republicación del código está sujeta a nuestras Normas internas.
Exención de responsabilidad
La información y las publicaciones no constituyen, ni deben considerarse como asesoramiento o recomendaciones financieras, de inversión, de trading o de otro tipo proporcionadas o respaldadas por TradingView. Más información en Condiciones de uso.