PROTECTED SOURCE SCRIPT
False highs and lows
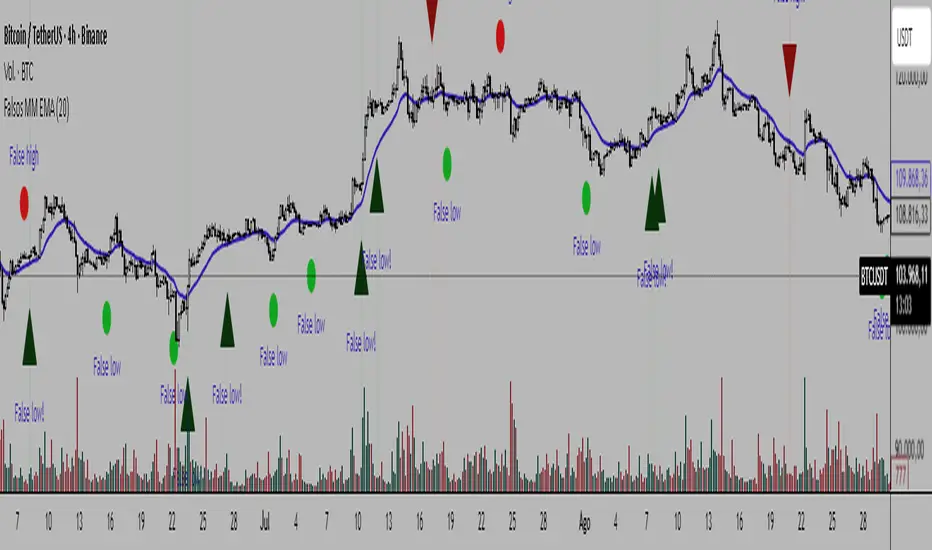
This technical indicator shows points of probable reversal. Specifically, it exploits the phenomenon of false highs and lows: supply or demand entries with strong momentum.
The signals with green and red arrows are in favor of the trend and above the EMA 20, so you should pay close attention to them. The signals marked with green and red circles also show great opportunities, but they should be studied with greater caution.
Warnings:
-Avoid entries on false highs when there is strong buying pressure (evident in bullish candles with high momentum).
-Avoid entries on false lows when there is strong selling pressure (evident in bearish candles with high momentum).
-Avoid entries on false lows when there is clear resistance and the price is overbought.
-Avoid entries on false highs when there is nearby support and the price is oversold.
-Avoid trading in very narrow price ranges.
-Wait for the close of the signaled candle for the pattern to be valid.
-I recommend using tight stop losses below the low (or above the high) of the pattern, and targeting reward-to-risk ratios that do not exceed 1:1 in most cases.
Script protegido
Este script se publica como código cerrado. Sin embargo, puede utilizarlo libremente y sin limitaciones: obtenga más información aquí.
📖Revista El Especulador:
drive.google.com/file/d/1Fs8l9xSpZIy5haCb5l0HWzgeAanOifs_/view?usp=drivesdk
👉t.me/ElEspeculador96 (Telegram)
drive.google.com/file/d/1Fs8l9xSpZIy5haCb5l0HWzgeAanOifs_/view?usp=drivesdk
👉t.me/ElEspeculador96 (Telegram)
Exención de responsabilidad
La información y las publicaciones que ofrecemos, no implican ni constituyen un asesoramiento financiero, ni de inversión, trading o cualquier otro tipo de consejo o recomendación emitida o respaldada por TradingView. Puede obtener información adicional en las Condiciones de uso.