INVITE-ONLY SCRIPT
BOSS Relative Strength Meter
THE BEST FOREX, STOCKS, COMMODITIES , AND CRYPTO INDICATORS FOR TRADINGVIEW.COM
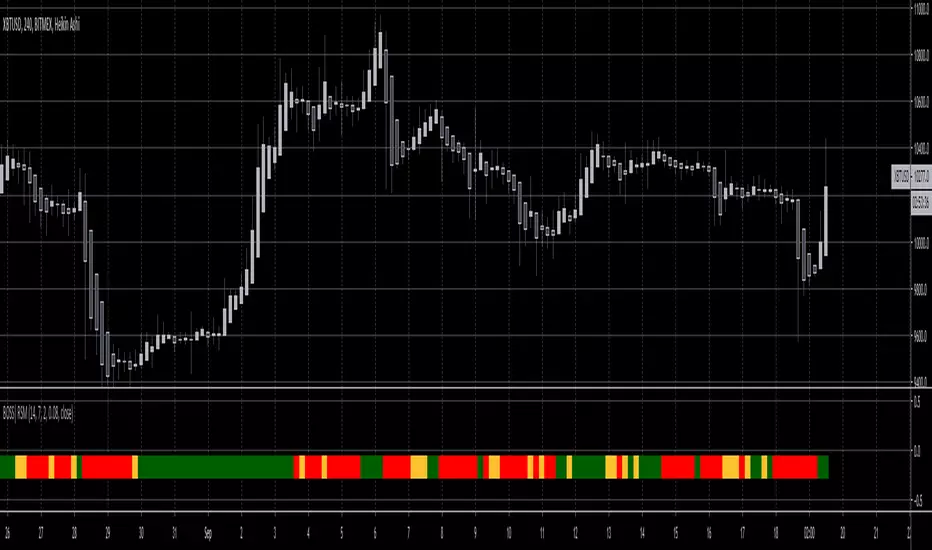
The relative strength meter (RSM) is a momentum indicator that measures the magnitude of recent price changes to evaluate overbought or oversold conditions in the price of a stock or other asset.
The RSM is displayed as a color coded meter.
GREEN: Bullish Uptrend
RED: Bearish Downtrend
YELLOW: Disbursement
Highlights:
Add to any chart or time frame
Prints on the current bar in real time
DOES NOT repaint several bars after the fact
Freedom to Tune
User can change colors
Available Here: https://bosscripts.com/products/relative-strength-meter
7_Day Trial:https://bosscripts.com/collections/7-day-trial/products/7-day-trial-boss-9-indicator-pro-trading-system
Script que requiere invitación
El acceso a este script está restringido a los usuarios autorizados por el autor y, por regla general, es de pago. Puede añadirlo a sus favoritos, pero solo podrá usarlo si solicita permiso al autor y éste le autoriza. Para obtener más información, póngase en contacto con TradingSafely o siga las siguientes instrucciones del autor.
TradingView recomienda no comprar ni utilizar un script si su autor no le ofrece total confianza o cuando no entienda cómo funciona. En muchos casos, puede encontrar una buena alternativa de código abierto de forma gratuita en nuestros Scripts de la comunidad.
Instrucciones del autor
″
¿Quiere utilizar este script en un gráfico?
Advertencia: Por favor, leer antes de solicitar acceso.
🚀 LinkTree: linktr.ee/TradingSafely
📊 SECTOR SPDR ETFs: tradingsafely.net/spdr
🚨 Trade Ideas: tradingsafely.net/trade-ideas/
📈 StockTwits: stocktwits.com/r/TradingSafely
📚 TV Course: bit.ly/32sLUBo
📊 SECTOR SPDR ETFs: tradingsafely.net/spdr
🚨 Trade Ideas: tradingsafely.net/trade-ideas/
📈 StockTwits: stocktwits.com/r/TradingSafely
📚 TV Course: bit.ly/32sLUBo
Exención de responsabilidad
La información y las publicaciones que ofrecemos, no implican ni constituyen un asesoramiento financiero, ni de inversión, trading o cualquier otro tipo de consejo o recomendación emitida o respaldada por TradingView. Puede obtener información adicional en las Condiciones de uso.