PROTECTED SOURCE SCRIPT
Hikmet ŞENLİKOĞLU basit strateji
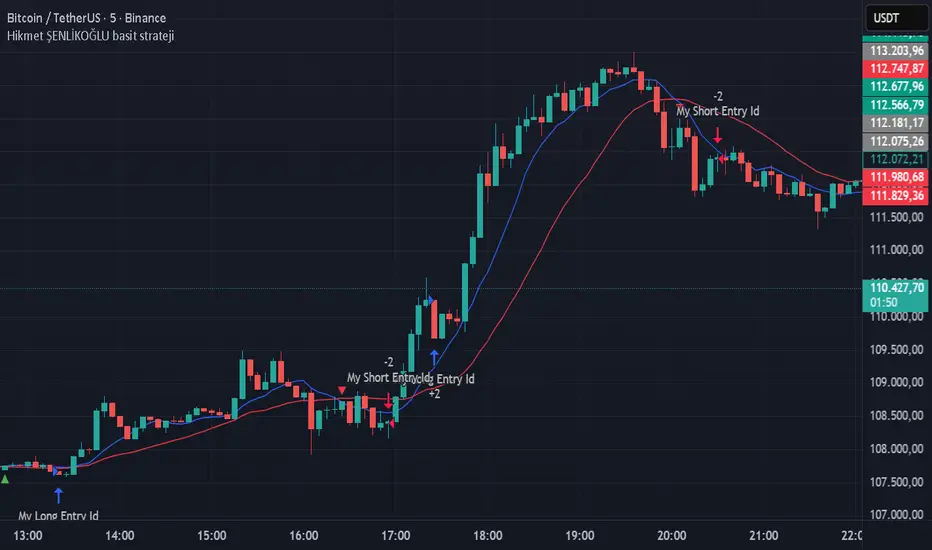
📊 Hikmet ŞENLİKOĞLU Simple Strategy – MA Crossover + RSI Filter System
This strategy is built on a simple yet powerful Moving Average Crossover (MA Crossover) concept designed to identify trend reversals.
It also integrates the Relative Strength Index (RSI) as a momentum filter to reduce false signals and focus only on strong buying and selling opportunities.
⚙️ Core Structure
1. Moving Average Crossover (MA Crossover)
The system uses two Simple Moving Averages (SMA):
Fast MA: 9 periods (default)
Slow MA: 21 periods (default)
Buy Signal: When the Fast MA crosses above the Slow MA (bullish crossover).
Sell Signal: When the Fast MA crosses below the Slow MA (bearish crossunder).
This mechanism aims to capture early trend reversals and follow the dominant market direction.
2. RSI Filter
The RSI adds an additional layer of confirmation:
Overbought level: 70
Oversold level: 30
Buy signals are valid only when RSI is below the overbought zone (RSI < 70),
while Sell signals are valid only when RSI is above the oversold zone (RSI > 30).
This filter helps avoid trades during weak or exhausted momentum phases.
📈 Chart Visuals
Blue line: Fast MA (short-term trend)
Red line: Slow MA (long-term trend)
Green triangle: Buy signal
Red triangle: Sell signal
These visual cues make it easy to follow trade signals directly on the chart.
🚨 Built-in Alerts
The strategy includes automatic alert conditions for live trading or notifications:
Buy Alert: “Price is turning bullish – Buy opportunity!”
Sell Alert: “Price is turning bearish – Sell opportunity!”
This allows traders to stay updated even when they’re away from the charts.
🧠 Summary
“There is power in simplicity.”
This strategy blends trend-following logic with a momentum-based filter, creating a reliable and intuitive system.
It’s simple enough for beginners, yet solid enough for experienced traders seeking a clean foundation for further optimization.
Script protegido
Este script se publica como código cerrado. Sin embargo, puede utilizarlo libremente y sin limitaciones: obtenga más información aquí.
Exención de responsabilidad
La información y las publicaciones que ofrecemos, no implican ni constituyen un asesoramiento financiero, ni de inversión, trading o cualquier otro tipo de consejo o recomendación emitida o respaldada por TradingView. Puede obtener información adicional en las Condiciones de uso.