OPEN-SOURCE SCRIPT
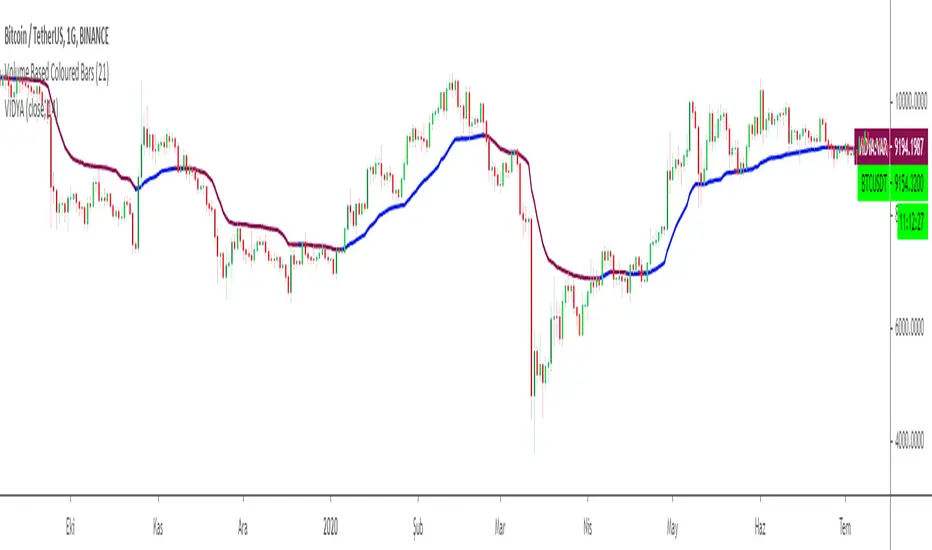
Variable Index Dynamic Average VIDYA

Chande's Variable Index Dynamic Average (VIDYA) is similar to the Exponential Moving Average (EMA), but automatically adjusts the smoothing weight based on price volatility.
VIDYA was developed by Tushar Chande and presented in Technical Analysis of Stocks & Commodities magazine in March 1992.
In the first version, a standard deviation was used as the Volatility Index
Chande modified VIDYA in October 1995 to use a new Chande Momentum Oscillator (CMO) as the Volatility Index.
So I decided to add an option for the users to change the calculation method.
Default calculation is by using Chande's Momentum Oscillator
Users can change the calculation method to Standart Deviation by unchecking the box on the settings menu.
Another option is to fix the CMO length parameter to 9 to make VIDYA more sensitive to price movements.
CMO parameter is defaultly fixed to 9 but users can change the length of the parameter to the VIDYA length by unchecking the relevant box.
As a moving average, VIDYA smooths the market noises and shows the market trends more clearly.
To achieve the goals, the indicator filters out the market fluctuations (noises) by averaging the price values of the periods, over which it is calculated. In the process, some extra value (weight) is added to the average prices, as it is done during calculations of all weighted indicators, such as EMA, LWMA, and SMMA. But during the VIDIYA indicator's calculation, every period's price receives a weight increment adapted to the current market's volatility.
Note that the value of the smoothing factor (k) is calculated with the help of the period's EMA, and increasing or decreasing of the value is achieved by using CMO Chande Momentum Oscillator as a measure of the market's volatility. As a result, the indicator slows down and does not react to the market's volatility when it increases and, on the contrary, speeds up when a strong steady trend takes place.
Note:
Alarm added for color changes.
Hope you use this one at profitable trades.
Script de código abierto
Fiel al espíritu de TradingView, el creador de este script lo ha convertido en código abierto, para que los traders puedan revisar y verificar su funcionalidad. ¡Enhorabuena al autor! Aunque puede utilizarlo de forma gratuita, recuerde que la republicación del código está sujeta a nuestras Normas internas.
Telegram t.me/AlgoRhytm
YouTube (Turkish): youtube.com/c/kivancozbilgic
YouTube (English): youtube.com/c/AlgoWorld
YouTube (Turkish): youtube.com/c/kivancozbilgic
YouTube (English): youtube.com/c/AlgoWorld
Exención de responsabilidad
La información y las publicaciones no constituyen, ni deben considerarse como asesoramiento o recomendaciones financieras, de inversión, de trading o de otro tipo proporcionadas o respaldadas por TradingView. Más información en Condiciones de uso.