OPEN-SOURCE SCRIPT
FantailVMA @DaviddTech
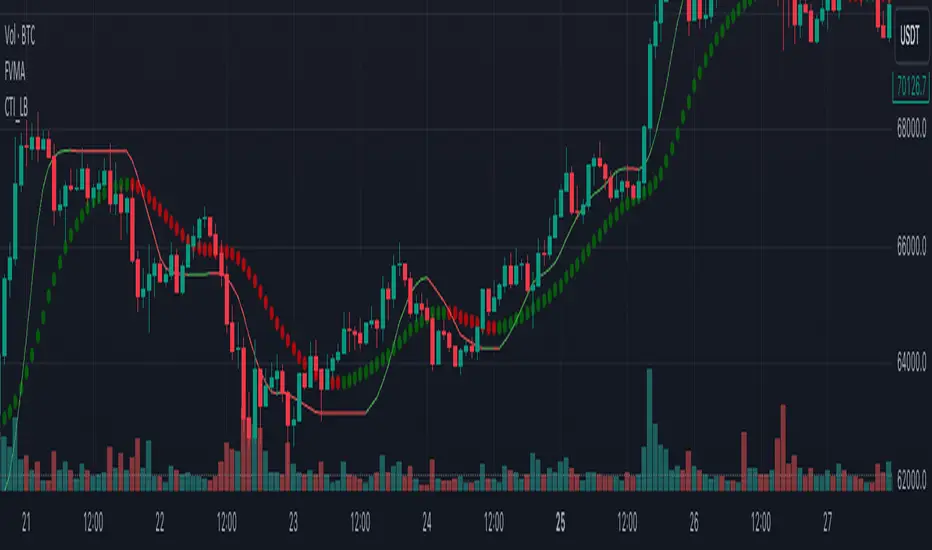
The FantailVMA (FVMA) indicator is a comprehensive technical analysis tool that combines the principles of moving averages and the Average True Range (ATR) indicator. Its unique design allows it to closely track the price movements while simultaneously highlighting the overarching trend direction of the asset or stock.
The FVMA indicator calculates a dynamic moving average line that adapts to the volatility of the market. It achieves this by incorporating the ATR into its calculations, which measures the average true range of price movements over a specified period. This integration ensures that the FVMA line remains responsive to changes in market volatility, adjusting its sensitivity accordingly.
One of the key advantages of the FVMA indicator is its ability to provide clear trend signals. When the price is trading above the FVMA line, it indicates an uptrend, suggesting that the asset is in a bullish phase. Conversely, when the price is trading below the FVMA line, it signals a downtrend, implying that the asset is in a bearish phase. This simple yet powerful interpretation allows traders to quickly identify the prevailing market direction and make informed trading decisions.
Furthermore, the FVMA indicator offers customization options, allowing users to adjust various parameters such as the ATR length, weighting, and moving average length. This flexibility enables traders to fine-tune the indicator's behavior to align with their specific trading strategies and preferences.
Overall, the FantailVMA indicator provides a comprehensive and adaptive solution for trend analysis, combining the strengths of moving averages and volatility measurements to deliver clear and actionable signals in dynamic market conditions.
Script de código abierto
Fiel al espíritu de TradingView, el creador de este script lo ha convertido en código abierto, para que los traders puedan revisar y verificar su funcionalidad. ¡Enhorabuena al autor! Aunque puede utilizarlo de forma gratuita, recuerde que la republicación del código está sujeta a nuestras Normas internas.
✅💰⚡ Become part of the community get early get access here:
daviddtech.com
🔥Telegram Group:
t.me/DaviddTech
⚡ Videos & Tutorials :
youtube.com/channel/UC7NJLsf6IonOy8QI8gt5BeA?sub_confirmation=1
♥ @DaviddTech
daviddtech.com
🔥Telegram Group:
t.me/DaviddTech
⚡ Videos & Tutorials :
youtube.com/channel/UC7NJLsf6IonOy8QI8gt5BeA?sub_confirmation=1
♥ @DaviddTech
Exención de responsabilidad
La información y las publicaciones no constituyen, ni deben considerarse como asesoramiento o recomendaciones financieras, de inversión, de trading o de otro tipo proporcionadas o respaldadas por TradingView. Más información en Condiciones de uso.