PROTECTED SOURCE SCRIPT
Actualizado Wave Momentum Indicator
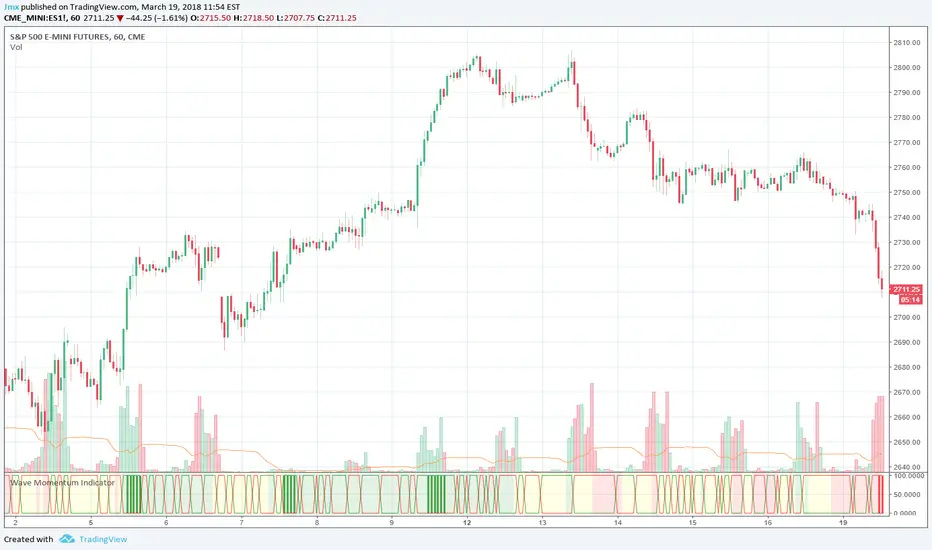
The Wave Momentum Indicator combines elements of Weiss Wave, Hilbert Sine Wave, and a trend analysis calculation to present trending and high probability entries.
Green and red horizontal lines indicate directional volume
Background color indicates whether trading trend is bullish , bearish , or choppy (related to price expansion in a given direction)
Green / Red vertical lines indicate potential entries during a session when trend has been established for a period (building volume and entering a bullish/bearish zone) and are only their for example and not trading advice.
At a glance, when you see green verticals it's a confirmation of a bullish trend while red verticals are a confirmation of a bearish trend.
Simple usage:
Enter bullish on green vertical/background, exit on chop zone (yellow) or when bullish volume ends.
There are built in alerts for the bullish and bearish entry conditions to make alerting easier.
This indicator was designed for trading choppy sessions of the SPX via ES1! (E-Mini Futures ). Works best on the 15m and 1hr time-frames.
Notas de prensa
* Fixed a timing issue in the code which was causing in-session bull/bear triggers to trigger late at certain time-frames (lower)* Proper labels for plots to assist in alert making or strategy writing
* Re-wrote the session logic as follows:
- Green Vertical: BUY Wave while in-session but after Whipsaw zone (0930-100)
- Red Vertical: SELL Wave while in-session but after whipsaw zone (0930-1000)
- Blue Vertical: BUY wave developing any other time
- Orange Vertical: Sell wave developing any other time
Updated the alerts and plots to reflect these new states so they can be properly alerted independently.
Notas de prensa
Updated backdrop coloring and chartScript protegido
Este script se publica como código cerrado. No obstante, puede utilizarlo libremente y sin ninguna limitación. Obtenga más información aquí.
Exención de responsabilidad
La información y las publicaciones no constituyen, ni deben considerarse como asesoramiento o recomendaciones financieras, de inversión, de trading o de otro tipo proporcionadas o respaldadas por TradingView. Más información en Condiciones de uso.
Script protegido
Este script se publica como código cerrado. No obstante, puede utilizarlo libremente y sin ninguna limitación. Obtenga más información aquí.
Exención de responsabilidad
La información y las publicaciones no constituyen, ni deben considerarse como asesoramiento o recomendaciones financieras, de inversión, de trading o de otro tipo proporcionadas o respaldadas por TradingView. Más información en Condiciones de uso.