OPEN-SOURCE SCRIPT
High Volume Zone Highlight
Description:
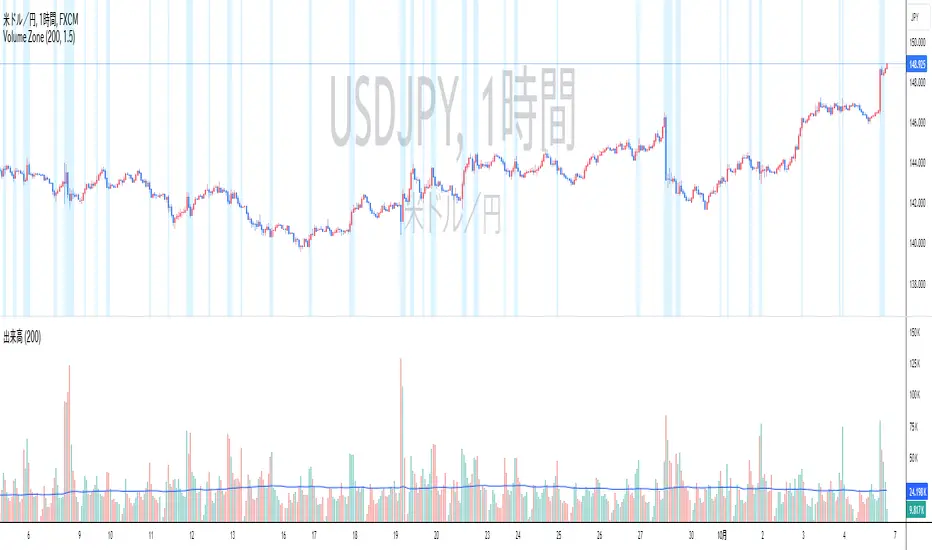
The High Volume Zone Highlight highlights areas on the chart where the volume exceeds a user-defined threshold based on a moving average. This helps traders visually identify zones of high trading activity.
Inputs:
Style Customization:
Users can adjust the color and transparency of the highlighted zones from the settings.
説明:
ハイ・ボリューム・ゾーン・ハイライトは、出来高が移動平均に基づいたユーザー定義の閾値を超えたエリアをチャート上で強調表示します。
設定項目:
スタイルカスタマイズ:
設定からハイライトされたゾーンの色や透明度を調整できます。
The High Volume Zone Highlight highlights areas on the chart where the volume exceeds a user-defined threshold based on a moving average. This helps traders visually identify zones of high trading activity.
- The moving average period and volume threshold are fully customizable.
- Background color highlights appear when the current volume is greater than a specified multiple of the volume moving average.
- Ideal for traders who want to spot significant volume changes relative to historical averages.
Inputs:
- Volume MA Length: The number of periods for calculating the volume moving average.
- Volume MA Factor: A multiplier to define the threshold. For example, setting this to 1.5 will highlight when the volume is 150% of the moving average.
Style Customization:
Users can adjust the color and transparency of the highlighted zones from the settings.
説明:
ハイ・ボリューム・ゾーン・ハイライトは、出来高が移動平均に基づいたユーザー定義の閾値を超えたエリアをチャート上で強調表示します。
- 移動平均期間と出来高閾値は自由にカスタマイズ可能です。
- 現在の出来高が出来高移動平均の指定した倍数を超えた場合、背景色が強調表示されます。
- 過去の平均と比較して重要な出来高の変化を検出したいトレーダーに最適です。
設定項目:
- 出来高移動平均期間:出来高移動平均を計算する際の期間。
- 出来高MA係数: 閾値を定義するための係数。たとえば、1.5に設定すると、出来高が移動平均の150%を超えたときにハイライトされます。
スタイルカスタマイズ:
設定からハイライトされたゾーンの色や透明度を調整できます。
Script de código abierto
Fiel al espíritu de TradingView, el creador de este script lo ha convertido en código abierto, para que los traders puedan revisar y verificar su funcionalidad. ¡Enhorabuena al autor! Aunque puede utilizarlo de forma gratuita, recuerde que la republicación del código está sujeta a nuestras Normas internas.
Exención de responsabilidad
La información y las publicaciones no constituyen, ni deben considerarse como asesoramiento o recomendaciones financieras, de inversión, de trading o de otro tipo proporcionadas o respaldadas por TradingView. Más información en Condiciones de uso.