OPEN-SOURCE SCRIPT
Actualizado EMA 50 & 200 (TF-specific)
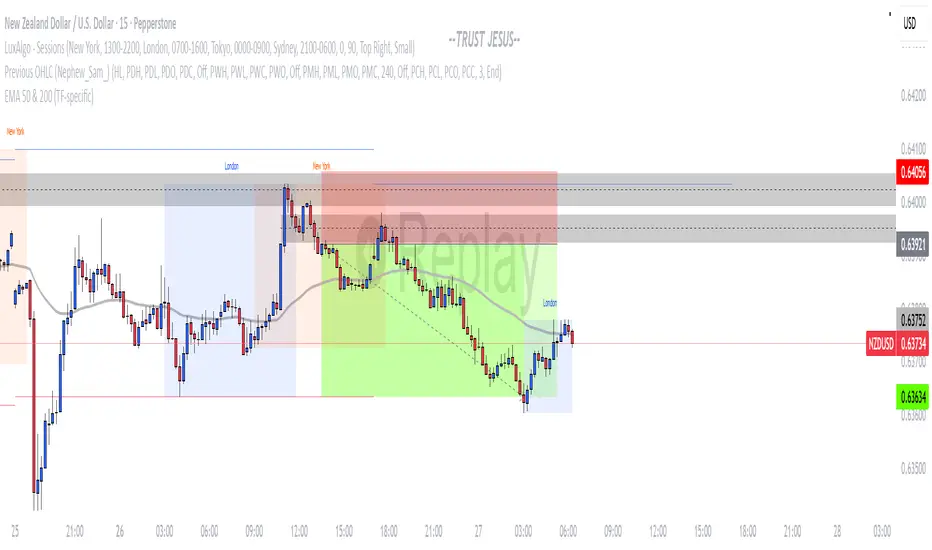
This script plots EMA 50 and EMA 200 only on the timeframes where they matter most:
EMA 50 (gray): visible on 1H, 4H, and 12H charts – often used by intraday traders.
EMA 200 (black): visible on Daily and Weekly charts – a classic long-term trend indicator.
🔹 Why use it?
Avoids clutter by showing each EMA only on the relevant timeframe.
Helps align intraday trading with higher timeframe trends.
Simple, clean, and effective for both swing and day trading.
Notas de prensa
This script plots EMA 50 and EMA 200 only on the timeframes where they matter most:EMA 50 (gray): visible on 5m, 15m, 30m, 1H, 4H, and 12H charts – often used by intraday traders.
EMA 200 (black): visible on Daily and Weekly charts – a classic long-term trend indicator.
🔹 Why use it?
Avoids clutter by showing each EMA only on the relevant timeframe.
Helps align intraday trading with higher timeframe trends.
Simple, clean, and effective for both swing and day trading.
Script de código abierto
Siguiendo fielmente el espíritu de TradingView, el creador de este script lo ha publicado en código abierto, permitiendo que otros traders puedan revisar y verificar su funcionalidad. ¡Enhorabuena al autor! Puede utilizarlo de forma gratuita, pero tenga en cuenta que la publicación de este código está sujeta a nuestras Normas internas.
Exención de responsabilidad
La información y las publicaciones que ofrecemos, no implican ni constituyen un asesoramiento financiero, ni de inversión, trading o cualquier otro tipo de consejo o recomendación emitida o respaldada por TradingView. Puede obtener información adicional en las Condiciones de uso.