OPEN-SOURCE SCRIPT
Actualizado RSI Pie
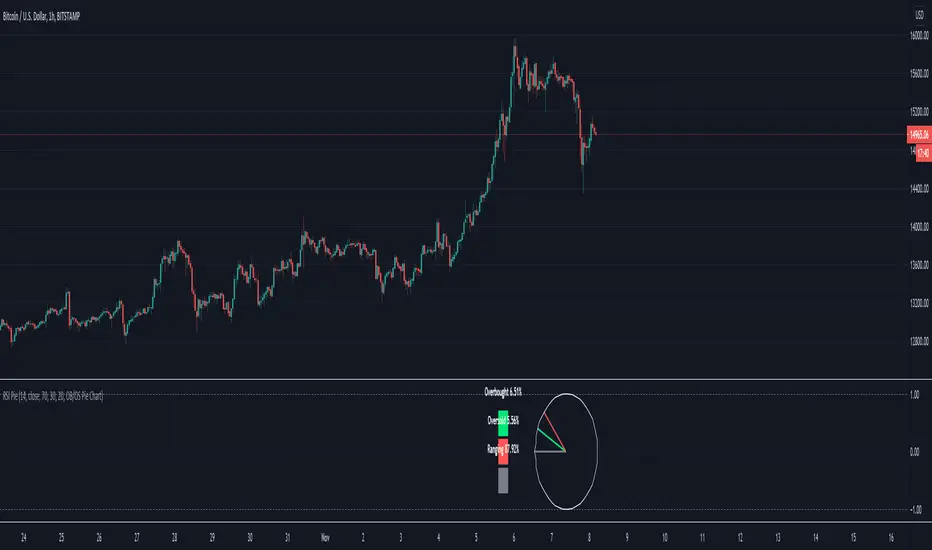
More a novelty than anything useful. Measures the % of overbought/sold RSI and renders as a pie chart. RSI % -> Radians -> (x,y) -> bar_time. 24hr market charts only.
Notas de prensa
Defunct. See : [url=https://www.tradingview.com/script/pHlXdeXI-Pie-Chart-Toolbox/]Pie Chart ToolboxNotas de prensa
See script Pie Chart Toolbox 
Script de código abierto
Fiel al espíritu de TradingView, el creador de este script lo ha convertido en código abierto, para que los traders puedan revisar y verificar su funcionalidad. ¡Enhorabuena al autor! Aunque puede utilizarlo de forma gratuita, recuerde que la republicación del código está sujeta a nuestras Normas internas.
Exención de responsabilidad
La información y las publicaciones no constituyen, ni deben considerarse como asesoramiento o recomendaciones financieras, de inversión, de trading o de otro tipo proporcionadas o respaldadas por TradingView. Más información en Condiciones de uso.