OPEN-SOURCE SCRIPT
EMA Ribbon - Adjustable with Toggles
📌 Script Name:
EMA Ribbon - Adjustable with Toggles
🧠 Primary Function:
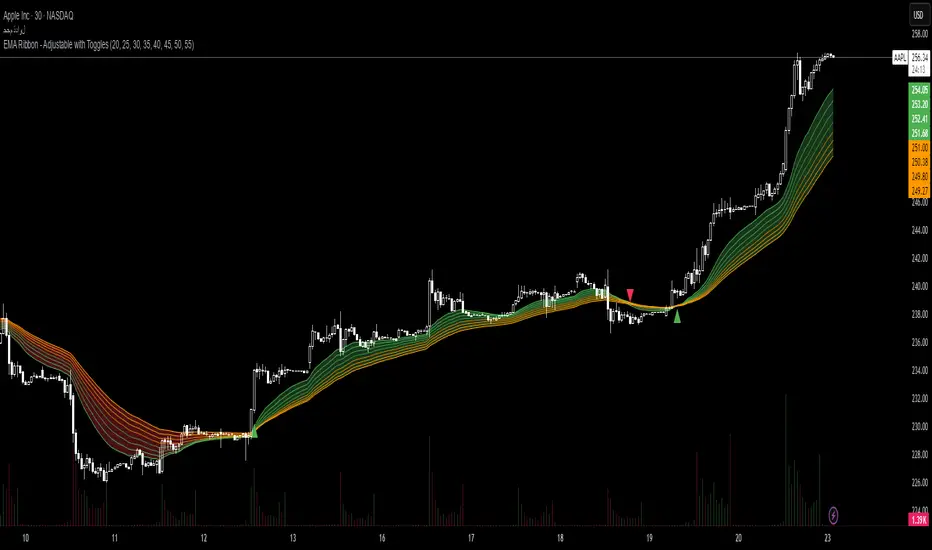
This script plots a customizable Exponential Moving Average (EMA) Ribbon on Trading View charts. It allows the user to enable or disable any of the 8 EMAs individually and shows buy/sell signals based on the crossover between the fastest and slowest EMAs.
⚙️ Key Features:
✅ User Controls:
Toggle ON/OFF each of the 8 EMAs independently.
Set the length of each EMA (from 1 upward).
EMA colors vary based on their speed (green for faster, orange for slower).
📈 EMA Calculation:
Calculates 8 separate EMAs using the closing price (close).
🎨 Chart Visualization:
Plots each EMA with a unique color and transparency.
Draws a colored ribbon between the highest and lowest active EMAs to visualize trend zones.
📊 Trend Direction Logic:
The trend is determined solely based on EMA 1 (fastest) and EMA 8 (slowest).
A bullish trend is when EMA 1 > EMA 8, and bearish when EMA 1 < EMA 8.
📍 Buy/Sell Signals:
Buy Signal: When the trend shifts from bearish to bullish (EMA 1 crosses above EMA 8).
Sell Signal: When the trend shifts from bullish to bearish (EMA 1 crosses below EMA 8).
Signals are displayed as green (buy) and red (sell) triangles on the chart.
🔔 Alerts:
Built-in alert conditions for buy and sell signals.
Custom alert messages in Arabic (can be modified if needed).
🌟 Additional Highlights:
Well-structured and easy to expand.
Great for trend-following strategies using EMA ribbons.
Helps identify consolidation zones and trend confirmation.
EMA Ribbon - Adjustable with Toggles
🧠 Primary Function:
This script plots a customizable Exponential Moving Average (EMA) Ribbon on Trading View charts. It allows the user to enable or disable any of the 8 EMAs individually and shows buy/sell signals based on the crossover between the fastest and slowest EMAs.
⚙️ Key Features:
✅ User Controls:
Toggle ON/OFF each of the 8 EMAs independently.
Set the length of each EMA (from 1 upward).
EMA colors vary based on their speed (green for faster, orange for slower).
📈 EMA Calculation:
Calculates 8 separate EMAs using the closing price (close).
🎨 Chart Visualization:
Plots each EMA with a unique color and transparency.
Draws a colored ribbon between the highest and lowest active EMAs to visualize trend zones.
📊 Trend Direction Logic:
The trend is determined solely based on EMA 1 (fastest) and EMA 8 (slowest).
A bullish trend is when EMA 1 > EMA 8, and bearish when EMA 1 < EMA 8.
📍 Buy/Sell Signals:
Buy Signal: When the trend shifts from bearish to bullish (EMA 1 crosses above EMA 8).
Sell Signal: When the trend shifts from bullish to bearish (EMA 1 crosses below EMA 8).
Signals are displayed as green (buy) and red (sell) triangles on the chart.
🔔 Alerts:
Built-in alert conditions for buy and sell signals.
Custom alert messages in Arabic (can be modified if needed).
🌟 Additional Highlights:
Well-structured and easy to expand.
Great for trend-following strategies using EMA ribbons.
Helps identify consolidation zones and trend confirmation.
Script de código abierto
Fiel al espíritu de TradingView, el creador de este script lo ha convertido en código abierto, para que los traders puedan revisar y verificar su funcionalidad. ¡Enhorabuena al autor! Aunque puede utilizarlo de forma gratuita, recuerde que la republicación del código está sujeta a nuestras Normas internas.
Exención de responsabilidad
La información y las publicaciones no constituyen, ni deben considerarse como asesoramiento o recomendaciones financieras, de inversión, de trading o de otro tipo proporcionadas o respaldadas por TradingView. Más información en Condiciones de uso.