PROTECTED SOURCE SCRIPT
JWAT INDY
Here’s a **professional, clear, and trader-friendly description** of your **Bollinger Band Mean Reversion Strategy**, written so you can use it in TradingView, a backtest report, or even in your trading plan document:
---
### 📊 **Bollinger Band Mean Reversion Strategy – Description**
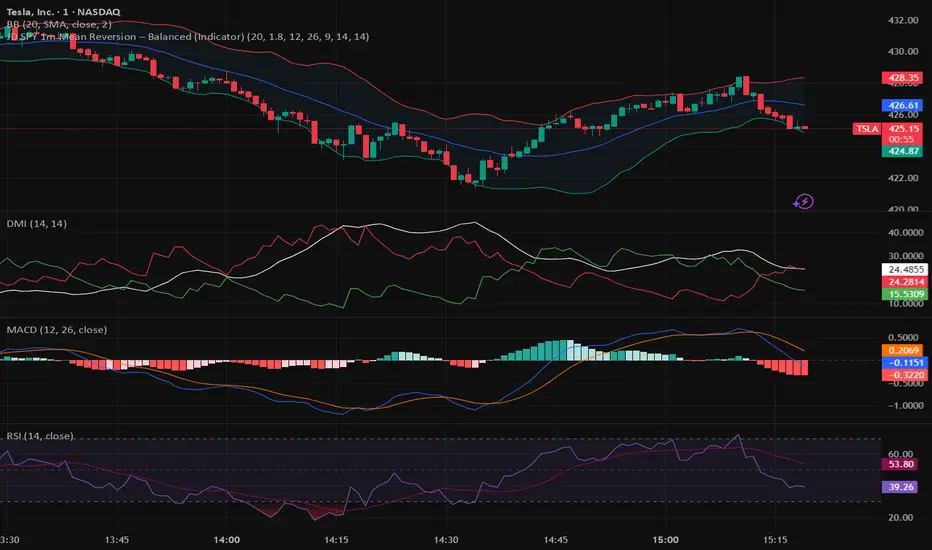
This strategy is designed to exploit short-term overextensions in price relative to its statistical mean using **Bollinger Bands** as the primary volatility framework. It assumes that when price deviates significantly from the mean (the middle band), market conditions are temporarily stretched, creating a high-probability opportunity for **reversion to the mean**.
The system uses a standard **20-period Bollinger Band** with a **2.0 standard-deviation multiplier** to define overbought and oversold zones. When price closes below the **lower band**, it signals potential exhaustion of selling pressure and triggers a **long (buy)** setup. Conversely, when price closes above the **upper band**, it indicates overbought conditions and triggers a **short (sell)** setup.
To improve trade quality and avoid false reversals, the strategy integrates **ADX (Average Directional Index)** or another trend filter to confirm that volatility expansion is not part of a strong trending move. Trades are taken only when the market is in a **low-to-moderate trend environment**, where mean-reverting behavior is statistically favored.
Each trade aims for a modest **take-profit target near the middle Bollinger Band (the moving average)**, representing a return to equilibrium, with a predefined **stop loss** beyond recent highs or lows to control risk. Position sizing can be dynamic—based on account equity or fixed contract size—to allow compounding through consistent percentage-based risk.
This approach is particularly effective on **short intraday timeframes (e.g., 1-minute or 5-minute SPY charts)**, where frequent oscillations occur within tight volatility bands. The goal is to capture small, repeatable edges from market overreactions while maintaining a strict discipline in trade execution and risk management.
---
### 🧩 **Key Features**
* Core indicator: **Bollinger Bands (20, 2.0)**
* Confirmation filter: **ADX threshold (e.g., <25)** to identify ranging conditions
* Entry logic:
* Long when price closes below lower band
* Short when price closes above upper band
* Exit logic:
* Take profit at the mid-band
* Stop loss beyond prior swing or fixed % distance
* Optional filters: Time of day, session volatility, or multi-timeframe trend confirmation
* Ideal for: **Mean-reversion scalping** on liquid instruments like SPY, QQQ, or futures
---
Would you like me to write a **shorter version (2–3 sentences)** for your TradingView strategy description box — or keep this **full detailed version** for a trading plan document or presentation?
---
### 📊 **Bollinger Band Mean Reversion Strategy – Description**
This strategy is designed to exploit short-term overextensions in price relative to its statistical mean using **Bollinger Bands** as the primary volatility framework. It assumes that when price deviates significantly from the mean (the middle band), market conditions are temporarily stretched, creating a high-probability opportunity for **reversion to the mean**.
The system uses a standard **20-period Bollinger Band** with a **2.0 standard-deviation multiplier** to define overbought and oversold zones. When price closes below the **lower band**, it signals potential exhaustion of selling pressure and triggers a **long (buy)** setup. Conversely, when price closes above the **upper band**, it indicates overbought conditions and triggers a **short (sell)** setup.
To improve trade quality and avoid false reversals, the strategy integrates **ADX (Average Directional Index)** or another trend filter to confirm that volatility expansion is not part of a strong trending move. Trades are taken only when the market is in a **low-to-moderate trend environment**, where mean-reverting behavior is statistically favored.
Each trade aims for a modest **take-profit target near the middle Bollinger Band (the moving average)**, representing a return to equilibrium, with a predefined **stop loss** beyond recent highs or lows to control risk. Position sizing can be dynamic—based on account equity or fixed contract size—to allow compounding through consistent percentage-based risk.
This approach is particularly effective on **short intraday timeframes (e.g., 1-minute or 5-minute SPY charts)**, where frequent oscillations occur within tight volatility bands. The goal is to capture small, repeatable edges from market overreactions while maintaining a strict discipline in trade execution and risk management.
---
### 🧩 **Key Features**
* Core indicator: **Bollinger Bands (20, 2.0)**
* Confirmation filter: **ADX threshold (e.g., <25)** to identify ranging conditions
* Entry logic:
* Long when price closes below lower band
* Short when price closes above upper band
* Exit logic:
* Take profit at the mid-band
* Stop loss beyond prior swing or fixed % distance
* Optional filters: Time of day, session volatility, or multi-timeframe trend confirmation
* Ideal for: **Mean-reversion scalping** on liquid instruments like SPY, QQQ, or futures
---
Would you like me to write a **shorter version (2–3 sentences)** for your TradingView strategy description box — or keep this **full detailed version** for a trading plan document or presentation?
Script protegido
Este script se publica como código cerrado. No obstante, puede utilizarlo libremente y sin ninguna limitación. Obtenga más información aquí.
Exención de responsabilidad
La información y las publicaciones no constituyen, ni deben considerarse como asesoramiento o recomendaciones financieras, de inversión, de trading o de otro tipo proporcionadas o respaldadas por TradingView. Más información en Condiciones de uso.