OPEN-SOURCE SCRIPT
Actualizado Multi MA Ribbon +
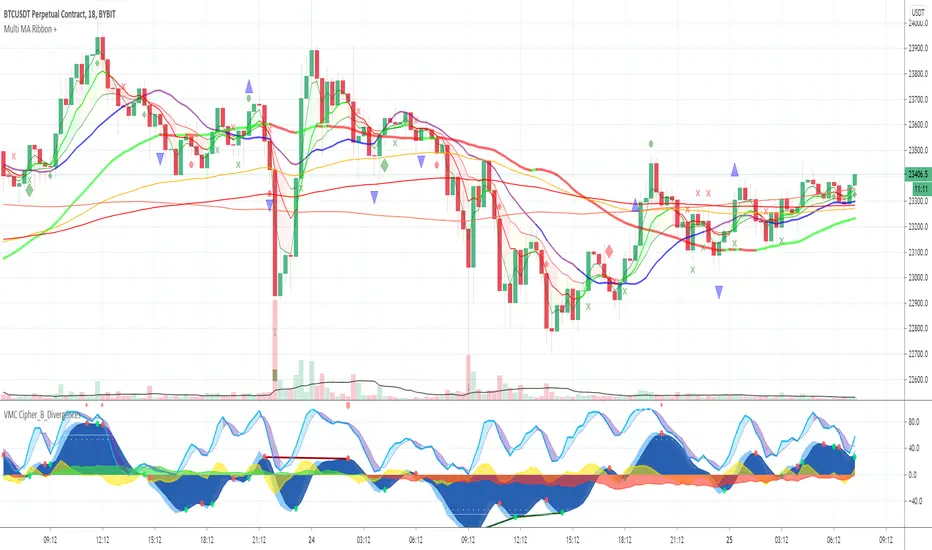
Draws an MA Ribbon that highlights major MA's and for easier visibility separates them into different groups including Custom MA's, Baseline MA's, T Line MA's, Short Term MA's and Long Term MA's.
Choose between 11 different types of MA's thanks to JustUncleL and John F. Ehlers super smoother.
The + is for various signals and alerts derived from Market Cipher / Wave Trend indicators and TCG etc.
Happy Trading and remember just follow the flow of the river!
Choose between 11 different types of MA's thanks to JustUncleL and John F. Ehlers super smoother.
The + is for various signals and alerts derived from Market Cipher / Wave Trend indicators and TCG etc.
Happy Trading and remember just follow the flow of the river!
Notas de prensa
Added staggered levels for RSI OB/OS Signals PLEASE USE SIGNALS WITH CAUTION AS THEY HAVE NOT BEEN BACK TESTED
Notas de prensa
Major Updates in this version;-Sorry guys I had to get rid of the 2 Custom MA's that were configured as Hull MA's - Please see my link in the comments section for a replacement
Added Momentum Setup Signals
Added Ability to adjust brightness
Added additional filters for Signals
Changed color for Minor Base Line - Minor Base Line is colored according to its EMA / SMA cross;
When Minor Base Line Direction is Up then Blue = Strength to Upside, Purple = Weakness to Upside
When Minor Base Line Direction is Down then Purple = Strength to Downside, Blue = Weakness to Downside
Please use signals with caution
Notas de prensa
Major Reliability Update to Signals - Still use with caution thoughRemoved RSI Stochastic
Adjusted Stochastic to faster value K = 5, D = 3, Smoothing = 2
Added Trend Filter To Market Cipher / Wave Trend & Momentum Setups
Notas de prensa
Removed Yellow X Market Cipher Signal as this was not a very useful signalAdjusted menues/inputs
Added;
Ability to adjust size of Momentum Setup Signals
Stop Loss Channel
How to use signals for entries
Look for Support or Resistance Levels for price to be attracted to
Find confluence with other indicators
Enable Stop Loss Channel and Ensure that you have a Decent Risk to Reward
Enter Long above the Setup Bar
Enter Short Below the Setup Bar
When looking to break out from Trendline or S/R Level - Look for confluence with Trend Meter by ensuring all 3 trend Meters are Highlighted the Same Color - Trend Meter can be found in my Double Stochastic Divergence Script
Use Signal Alerts so that you don't have to stare at the screen all day
Notas de prensa
Adjusted Filter X parametersAdded ability to adjust Momentum Strategy triangle size
Easier to turn of various parts of the Ribbon via drop down menu
Notas de prensa
Added more Alerts Ability to turn small diamonds off /on when Big diamond
Notas de prensa
Major Mod -Rearranged MA's
Added 11 MA for easier visual for when it crosses with the 15 MA
Removed 55 and 60 MA so that I could add yellow Caution Cloud which highlights temporary weakness in the current trend
Yellow Caution Cloud is derived from Madrid Trend Spotter and looks at the difference in the rate of change between 2 MA's
Notas de prensa
-Notas de prensa
Cleaned up the codeChanged some defaults for inputs
Added Additional Parameters to Strength and Weakness Cloud
Notas de prensa
Major Changes in this versionLess options for your MA's - means more user friendly menus, less load time
Added Dual SMA and EMA option for MA 100 & 200
Notas de prensa
Fixed spelling mistakeNotas de prensa
Fixed a fault you can now display the RiverScript de código abierto
Fiel al espíritu de TradingView, el creador de este script lo ha convertido en código abierto, para que los traders puedan revisar y verificar su funcionalidad. ¡Enhorabuena al autor! Aunque puede utilizarlo de forma gratuita, recuerde que la republicación del código está sujeta a nuestras Normas internas.
Exención de responsabilidad
La información y las publicaciones no constituyen, ni deben considerarse como asesoramiento o recomendaciones financieras, de inversión, de trading o de otro tipo proporcionadas o respaldadas por TradingView. Más información en Condiciones de uso.
Script de código abierto
Fiel al espíritu de TradingView, el creador de este script lo ha convertido en código abierto, para que los traders puedan revisar y verificar su funcionalidad. ¡Enhorabuena al autor! Aunque puede utilizarlo de forma gratuita, recuerde que la republicación del código está sujeta a nuestras Normas internas.
Exención de responsabilidad
La información y las publicaciones no constituyen, ni deben considerarse como asesoramiento o recomendaciones financieras, de inversión, de trading o de otro tipo proporcionadas o respaldadas por TradingView. Más información en Condiciones de uso.