OPEN-SOURCE SCRIPT
Actualizado RedK VADER - Volume-Accelerated Directional Energy Ratio
RedK VADER - Volume-Accelerated Directional Energy Ratio
Overview
RedK VADER is an indicator that analyzes market trends by calculating the energy ratio based on price movement and volume. It utilizes Zero Lag EMA smoothing to provide faster and more responsive signals.
Features
✅ Considers both price action and volume: Calculates the energy ratio of upward and downward movements to assess market strength.
✅ Zero Lag Smoothing: Uses EMA-based smoothing to minimize lag and improve responsiveness.
✅ Histogram Display: Helps visualize trend strength and potential reversals.
✅ Simple yet effective: Uses short-term and long-term energy differences to generate intuitive trade signals.
How to Use
📌 Blue Line (RedK VADER): Indicates trend direction and strength.
📌 Orange Line (Signal Line): A smoothed version of VADER; crossovers provide trade signals.
📌 Histogram (Green Bars): Represents the difference between VADER and the signal line. When crossing the zero line, it may indicate a trend reversal.
Trade Signals
🔵 Buy Signal: When RedK VADER crosses above the signal line.
🔴 Sell Signal: When RedK VADER crosses below the signal line.
⚡ Trend Strength: The larger the histogram bars, the stronger the trend.
Use this indicator to gain deeper market insights and enhance your trading decisions! 🚀
Notas de prensa
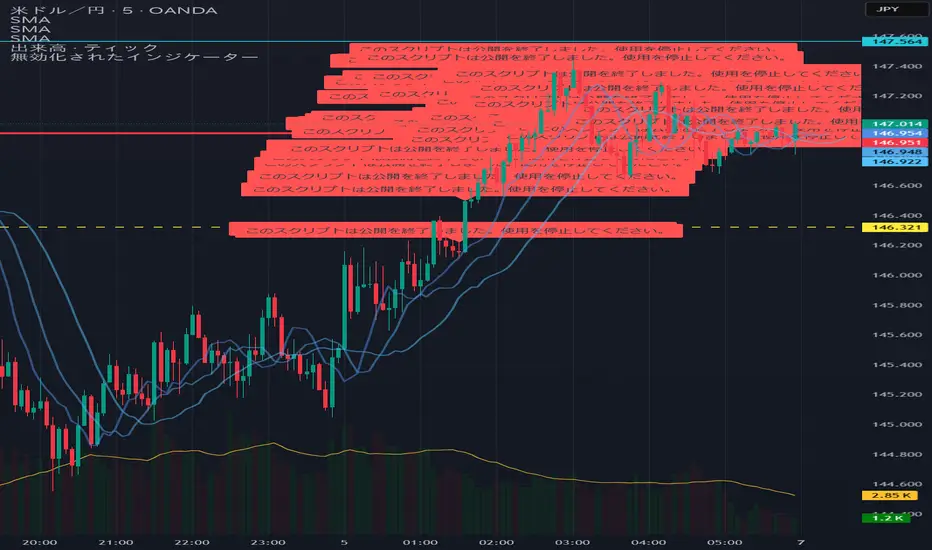
This script is no longer supported or maintained.The indicator is no longer available for public use.
Please remove it from your chart if you are still using it.
Thank you for your understanding.
Notas de prensa
This script is no longer supported or maintained.The indicator is no longer available for public use.
Please remove it from your chart if you are still using it.
Thank you for your understanding.
Script de código abierto
Fiel al espíritu de TradingView, el creador de este script lo ha convertido en código abierto, para que los traders puedan revisar y verificar su funcionalidad. ¡Enhorabuena al autor! Aunque puede utilizarlo de forma gratuita, recuerde que la republicación del código está sujeta a nuestras Normas internas.
Exención de responsabilidad
La información y las publicaciones no constituyen, ni deben considerarse como asesoramiento o recomendaciones financieras, de inversión, de trading o de otro tipo proporcionadas o respaldadas por TradingView. Más información en Condiciones de uso.