PROTECTED SOURCE SCRIPT
Reversal Top Bottom Hunter

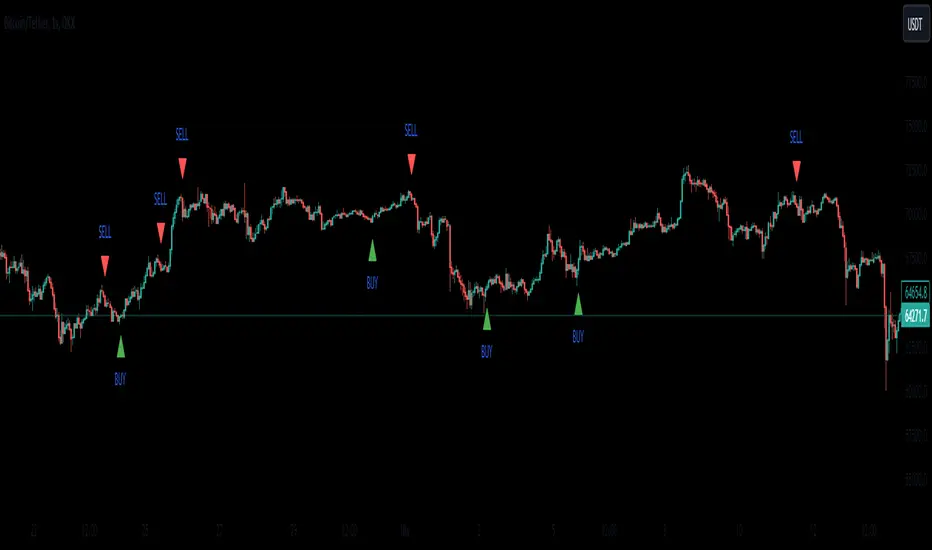
This indicator is designed to detect buying and selling opportunities in financial markets by tracking peak and bottom points to identify potential reversal points, providing investors with potential entry and exit signals.
How It Works?
Peak and Bottom Definition: The indicator calculates the highest (peak) and lowest (bottom) prices for specified periods. These values form the basis of the signal triggering mechanism.
User Settings: Users can adjust the lookback period for identifying the peak and bottom points as well as the number of bars within which the conditions for buy or sell signals need to be met. This customization allows for greater flexibility and adaptation to different trading styles and market conditions.
Buy Signal: If the previous candle's lowest price equals the lowest bottom value over the specified period and other conditions are met (such as the previous high being lower than the one before it, and the closing price being higher than the previous opening price), a buy signal is generated. The buy signal is valid within a specified confirmation period and is triggered when the closing price is higher than the referenced high.
Sell Signal: If the previous candle's highest price equals the highest peak value over the specified period and other conditions are met (such as the previous low being higher than the one before it, and the closing price being lower than the previous high), a sell signal is generated. The sell signal is also valid within the specified confirmation period and is triggered when the closing price is lower than the referenced low.
Visual Signals
Buy Signal: Represented by a green triangle and displayed below the candle.
Sell Signal: Represented by a red triangle and displayed above the candle.
Alerts
The indicator includes alert conditions to inform users when buy and sell signals are generated. These alerts are triggered when a signal is produced within the defined confirmation period.
Conclusion
This indicator helps investors identify potential buying and selling points in the market. However, it is important to consider other market conditions and technical analysis tools before making any investment decisions. The customizable settings for the confirmation period and the number of bars for condition checks make this indicator adaptable to various market scenarios.

This indicator was inspired by the work of the analyst @TuncerSengoz.
How It Works?
Peak and Bottom Definition: The indicator calculates the highest (peak) and lowest (bottom) prices for specified periods. These values form the basis of the signal triggering mechanism.
User Settings: Users can adjust the lookback period for identifying the peak and bottom points as well as the number of bars within which the conditions for buy or sell signals need to be met. This customization allows for greater flexibility and adaptation to different trading styles and market conditions.
Buy Signal: If the previous candle's lowest price equals the lowest bottom value over the specified period and other conditions are met (such as the previous high being lower than the one before it, and the closing price being higher than the previous opening price), a buy signal is generated. The buy signal is valid within a specified confirmation period and is triggered when the closing price is higher than the referenced high.
Sell Signal: If the previous candle's highest price equals the highest peak value over the specified period and other conditions are met (such as the previous low being higher than the one before it, and the closing price being lower than the previous high), a sell signal is generated. The sell signal is also valid within the specified confirmation period and is triggered when the closing price is lower than the referenced low.
Visual Signals
Buy Signal: Represented by a green triangle and displayed below the candle.
Sell Signal: Represented by a red triangle and displayed above the candle.
Alerts
The indicator includes alert conditions to inform users when buy and sell signals are generated. These alerts are triggered when a signal is produced within the defined confirmation period.
Conclusion
This indicator helps investors identify potential buying and selling points in the market. However, it is important to consider other market conditions and technical analysis tools before making any investment decisions. The customizable settings for the confirmation period and the number of bars for condition checks make this indicator adaptable to various market scenarios.
This indicator was inspired by the work of the analyst @TuncerSengoz.
Script protegido
Este script se publica como código cerrado. No obstante, puede utilizarlo libremente y sin ninguna limitación. Obtenga más información aquí.
Exención de responsabilidad
La información y las publicaciones no constituyen, ni deben considerarse como asesoramiento o recomendaciones financieras, de inversión, de trading o de otro tipo proporcionadas o respaldadas por TradingView. Más información en Condiciones de uso.