PROTECTED SOURCE SCRIPT
Smart Trade Levels
Auto Entry/SL/TP + Relative Levels + Dashboard + Meter
This indicator combines several trading tools into a single framework for market analysis and trade management.
🔹 Features
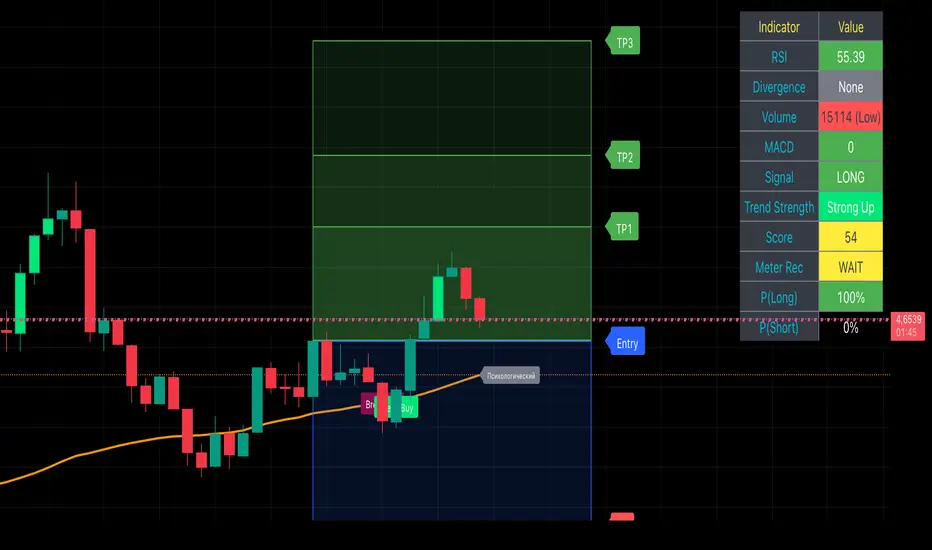
Automatic Entry/Stop-Loss/Take-Profit zones
• Entry is set on new LONG/SHORT signals.
• Stop-Loss is based on local pivots or percentage distance.
• Take-Profit targets are calculated with Fibonacci extensions (TP1, TP2, TP3).
Relative Support/Resistance Levels
• Dynamic levels based on a 50-period SMA as the base.
• Optional auto-hide function to display only nearby levels.
• Short RU labels (e.g. “Поддержка”, “Сопротивление”) without numeric values.
Trend & Signal Detection
• RSI, MACD, and SMA50 trend filter.
• Breakout detection with higher-timeframe (HTF) confirmation.
• Divergence alerts (bullish/bearish).
Meter & Score Dashboard
• Multi-factor score (volume, ATR, ADX, breakouts, trend alignment).
• Probability estimates for LONG vs SHORT (percentages).
• HTF filters (EMA50, RSI, MACD histogram).
• Color-coded signals and a compact on-chart dashboard.
Visualization
• Boxes for Entry, SL, TP1–TP3.
• Relative level lines with dotted style.
• Prep signals (Buy/Sell labels) when price crosses relative levels.
• Optional MA50 plot for trend context.
⚙️ Inputs
Fibonacci multipliers for TP (0.618, 1.0, 1.618 by default).
Volume SMA length and neutral band.
Auto-hide relative levels (with adjustable % window).
Meter settings: breakout lookback, relative volume, ATR %, ADX threshold, EMA gap filter.
Show/hide dashboard elements, MA50 line, and level labels.
✅ Use cases
Identify trend direction and potential reversals.
Manage risk/reward with automatic zones.
Confirm setups with HTF filters and probability scoring.
Visualize dynamic support/resistance areas.
⚠️ Disclaimer: This script is for educational purposes only and does not constitute financial advice. Always backtest and validate before applying to live trading.
This indicator combines several trading tools into a single framework for market analysis and trade management.
🔹 Features
Automatic Entry/Stop-Loss/Take-Profit zones
• Entry is set on new LONG/SHORT signals.
• Stop-Loss is based on local pivots or percentage distance.
• Take-Profit targets are calculated with Fibonacci extensions (TP1, TP2, TP3).
Relative Support/Resistance Levels
• Dynamic levels based on a 50-period SMA as the base.
• Optional auto-hide function to display only nearby levels.
• Short RU labels (e.g. “Поддержка”, “Сопротивление”) without numeric values.
Trend & Signal Detection
• RSI, MACD, and SMA50 trend filter.
• Breakout detection with higher-timeframe (HTF) confirmation.
• Divergence alerts (bullish/bearish).
Meter & Score Dashboard
• Multi-factor score (volume, ATR, ADX, breakouts, trend alignment).
• Probability estimates for LONG vs SHORT (percentages).
• HTF filters (EMA50, RSI, MACD histogram).
• Color-coded signals and a compact on-chart dashboard.
Visualization
• Boxes for Entry, SL, TP1–TP3.
• Relative level lines with dotted style.
• Prep signals (Buy/Sell labels) when price crosses relative levels.
• Optional MA50 plot for trend context.
⚙️ Inputs
Fibonacci multipliers for TP (0.618, 1.0, 1.618 by default).
Volume SMA length and neutral band.
Auto-hide relative levels (with adjustable % window).
Meter settings: breakout lookback, relative volume, ATR %, ADX threshold, EMA gap filter.
Show/hide dashboard elements, MA50 line, and level labels.
✅ Use cases
Identify trend direction and potential reversals.
Manage risk/reward with automatic zones.
Confirm setups with HTF filters and probability scoring.
Visualize dynamic support/resistance areas.
⚠️ Disclaimer: This script is for educational purposes only and does not constitute financial advice. Always backtest and validate before applying to live trading.
Script protegido
Este script se publica como código cerrado. Sin embargo, puede utilizarlo libremente y sin limitaciones: obtenga más información aquí.
Exención de responsabilidad
La información y las publicaciones que ofrecemos, no implican ni constituyen un asesoramiento financiero, ni de inversión, trading o cualquier otro tipo de consejo o recomendación emitida o respaldada por TradingView. Puede obtener información adicional en las Condiciones de uso.