PROTECTED SOURCE SCRIPT
Gann Swings with Weis Wave Volume
This indicator combines two powerful market analysis techniques into a single, comprehensive tool: swing analysis based on the theories of W.D. Gann and volume analysis popularized by David Weis (Weis Wave).[1] By visualizing the market's wave structure and the volume that drives each move, this indicator helps traders gauge the strength of a trend and identify potential reversals.[2][3]
Key Features
Gann Swing Lines:
The indicator automatically identifies and plots market swings by connecting significant highs and lows.[4] This provides a clean, intuitive view of the market's structure and the prevailing trend direction.[2]
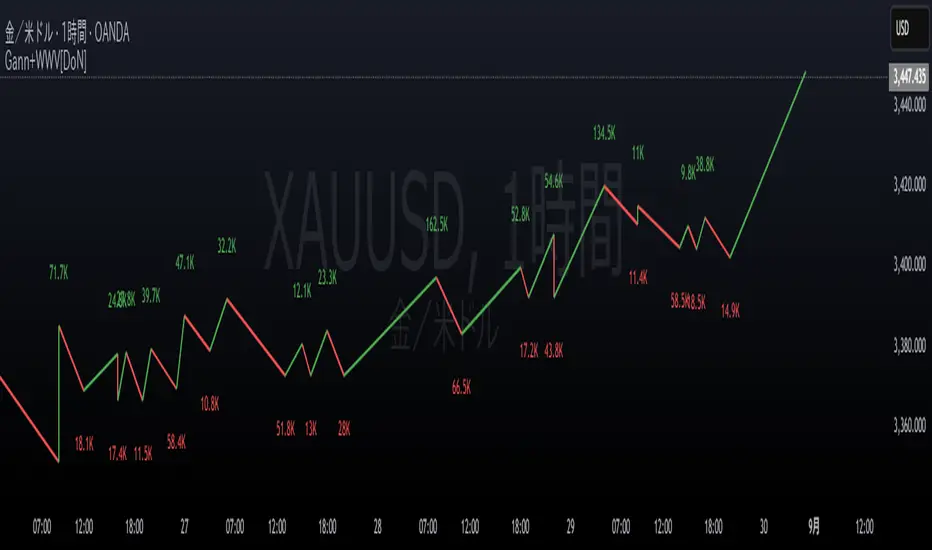
Upward swings are colored green, and downward swings are colored red (by default), making it easy to see the market's flow at a glance.[5] A real-time line is also drawn to track the current, developing swing.
Weis Wave Volume Display:
At the conclusion of each swing, the indicator calculates the total cumulative volume for that entire price wave and displays it at the swing's peak or trough.[1][6] This is the core of the Weis Wave concept, linking volume directly to price swings rather than individual candles.[3]
This feature allows traders to analyze the "effort vs. result." For example, a long upward price swing that occurs on low cumulative volume may suggest a lack of conviction and a higher probability of reversal.[7][8] Conversely, a breakout past a previous swing high accompanied by significant volume confirms the strength of the move.[7]
The cumulative volume for the current, unfinished wave is also displayed in real-time with an underscore (_) suffix.
Volume-Based Candle Coloring:
This optional feature colors the price bars based on their volume relative to a moving average (EMA) of volume.
Candles with significantly higher-than-average volume are painted in darker, more intense shades of green (for up-candles) or red (for down-candles).
This helps to instantly spot high-interest areas, such as climactic buying or selling, which often occur at key support and resistance levels or turning points.
Settings (Inputs) Explained
Gann Swing Settings:
Show Gann Swing Lines: Toggles the visibility of the swing lines.
Line Width: Adjusts the thickness of the swing lines.
Up Swing/Down Swing: Allows for full customization of the colors for up and down swing lines.
Volume Numbers Settings:
Show Volume Numbers: Toggles the visibility of the cumulative Weis Wave volume labels.
Up Volume/Down Volume: Customizes the text color for the volume numbers on up and down swings.
Size: Changes the font size of the volume labels ("Tiny" to "Huge").
Volume Unit: Formats the volume display. Choose "None" for the raw number, "K" for thousands, "M" for millions, or "B" for billions to keep the chart clean.
Additional Visual Settings:
Show Volume Candles: Enables or disables the volume-based bar coloring.
Volume EMA Period: Sets the lookback period for the Exponential Moving Average used to calculate average volume for the bar coloring feature.
How to Use
This indicator can be a valuable addition to various trading strategies.[9]
Trend Confirmation: A healthy trend will typically show increasing cumulative volume on swings in the direction of the trend. For instance, in a strong uptrend, each new upswing should ideally be accompanied by volume that is equal to or greater than the previous upswing.
Divergence and Reversal Signals: A classic signal of a weakening trend is divergence.[9] If the price makes a new higher high, but the cumulative volume on that upswing is significantly lower than the previous one, it indicates that the buying pressure is fading and a reversal may be imminent.
Identifying Key Levels: The points where swings reverse, especially when accompanied by high cumulative volume, often become critical support or resistance levels for future price action. The volume-colored candles can further highlight specific bars where institutional activity is likely occurring.
このインジケーターは、W.D.ギャンの理論に基づいたスイング分析と、デビッド・ワイスが普及させた出来高分析(ワイスウェーブ)を組み合わせたテクニカル分析ツールです。相場の波動(スイング)とそのスイングを形成するためにどれだけの出来高が投入されたかを視覚的に捉えることで、トレンドの強弱や転換の可能性を評価するのに役立ちます。
主な機能
ギャンスイングの描画:
相場の高値と安値を基に、上昇スイングと下降スイングを自動で識別し、ラインで結んで表示します。
これにより、市場の基本的な構造やトレンドの方向性を直感的に把握できます。
上昇スイングは緑色、下降スイングは赤色(デフォルト設定)で表示され、現在進行中のスイングはリアルタイムで描画され続けます。
ワイスウェーブ出来高の表示:
一つのスイング(波)が完了するごとに、そのスイングの始点から終点までの累計出来高を計算し、スイングの頂点(高値・安値)に表示します。
大きな価格変動(スイング)が出来高を伴っているか、あるいは出来高が乏しい中で価格だけが動いているかを判断する材料となります。
例1: 上昇スイングの価格幅が大きいにも関わらず出来高数値が小さい場合、その上昇の勢いが弱い可能性を示唆します。
例2: 価格の動きは小さいのに出来高数値が非常に大きい場合、強い抵抗や支持、あるいは市場の意見が対立している状況を示唆します。
現在進行中のスイングの累計出来高も、末尾に「_」を付けてリアルタイムで表示します。
出来高ローソク足の色付け:
オプションを有効にすると、各ローソク足の出来高を移動平均線(EMA)と比較し、その出来高の大きさに応じてローソク足を色付けします。
出来高が平均よりも大幅に大きい足は濃い色で表示され、市場の注目が集まっている価格帯(重要な高値・安値など)を特定するのに役立ちます。
設定項目(インプット)の解説
ギャンスイング設定:
ギャンスイングラインを表示: スイングラインの表示/非表示を切り替えます。
線の太さ: ラインの太さを調整します。
上昇スイング/下降スイング: 各スイングラインの色を自由に設定できます。
出来高数値の設定:
出来高数値を表示: スイングごとの累計出来高の表示/非表示を切り替えます。
上昇出来高/下降出来高: 出来高数値のテキスト色を自由に設定できます。
サイズ: 出来高数値の文字サイズを選択できます。
出来高の単位: 出来高の数値をそのまま表示するか、「K」(千)、「M」(百万)、「B」(十億)単位に変換して表示するかを選択できます。
追加の視覚設定:
出来高ローソク足を表示: 出来高に応じたローソク足の色付け機能の有効/無効を切り替えます。
出来高EMA期間: ローソク足の色付けの基準となる出来高移動平均線の期間を設定します。
活用方法
このインジケーターは、単独で使うだけでなく、他のテクニカル指標と組み合わせることで、より精度の高い分析が可能になります。
トレンドの確認: 価格が上昇スイングを続けており、かつ各上昇スイングの出来高が増加傾向にあれば、強い上昇トレンドと判断できます。
トレンド転換の察知: 価格は新高値を更新しているのに、上昇スイングの出来高が前回よりも著しく減少している場合(ダイバージェンス)、上昇の勢いが尽きかけており、トレンド転換が近い可能性を示唆します。
重要な価格帯の特定: 出来高ローソク足機能で色が濃くなっている価格帯は、多くの市場参加者が取引したことを意味し、将来的にサポート(支持)やレジスタンス(抵抗)として機能する可能性があります。
Key Features
Gann Swing Lines:
The indicator automatically identifies and plots market swings by connecting significant highs and lows.[4] This provides a clean, intuitive view of the market's structure and the prevailing trend direction.[2]
Upward swings are colored green, and downward swings are colored red (by default), making it easy to see the market's flow at a glance.[5] A real-time line is also drawn to track the current, developing swing.
Weis Wave Volume Display:
At the conclusion of each swing, the indicator calculates the total cumulative volume for that entire price wave and displays it at the swing's peak or trough.[1][6] This is the core of the Weis Wave concept, linking volume directly to price swings rather than individual candles.[3]
This feature allows traders to analyze the "effort vs. result." For example, a long upward price swing that occurs on low cumulative volume may suggest a lack of conviction and a higher probability of reversal.[7][8] Conversely, a breakout past a previous swing high accompanied by significant volume confirms the strength of the move.[7]
The cumulative volume for the current, unfinished wave is also displayed in real-time with an underscore (_) suffix.
Volume-Based Candle Coloring:
This optional feature colors the price bars based on their volume relative to a moving average (EMA) of volume.
Candles with significantly higher-than-average volume are painted in darker, more intense shades of green (for up-candles) or red (for down-candles).
This helps to instantly spot high-interest areas, such as climactic buying or selling, which often occur at key support and resistance levels or turning points.
Settings (Inputs) Explained
Gann Swing Settings:
Show Gann Swing Lines: Toggles the visibility of the swing lines.
Line Width: Adjusts the thickness of the swing lines.
Up Swing/Down Swing: Allows for full customization of the colors for up and down swing lines.
Volume Numbers Settings:
Show Volume Numbers: Toggles the visibility of the cumulative Weis Wave volume labels.
Up Volume/Down Volume: Customizes the text color for the volume numbers on up and down swings.
Size: Changes the font size of the volume labels ("Tiny" to "Huge").
Volume Unit: Formats the volume display. Choose "None" for the raw number, "K" for thousands, "M" for millions, or "B" for billions to keep the chart clean.
Additional Visual Settings:
Show Volume Candles: Enables or disables the volume-based bar coloring.
Volume EMA Period: Sets the lookback period for the Exponential Moving Average used to calculate average volume for the bar coloring feature.
How to Use
This indicator can be a valuable addition to various trading strategies.[9]
Trend Confirmation: A healthy trend will typically show increasing cumulative volume on swings in the direction of the trend. For instance, in a strong uptrend, each new upswing should ideally be accompanied by volume that is equal to or greater than the previous upswing.
Divergence and Reversal Signals: A classic signal of a weakening trend is divergence.[9] If the price makes a new higher high, but the cumulative volume on that upswing is significantly lower than the previous one, it indicates that the buying pressure is fading and a reversal may be imminent.
Identifying Key Levels: The points where swings reverse, especially when accompanied by high cumulative volume, often become critical support or resistance levels for future price action. The volume-colored candles can further highlight specific bars where institutional activity is likely occurring.
このインジケーターは、W.D.ギャンの理論に基づいたスイング分析と、デビッド・ワイスが普及させた出来高分析(ワイスウェーブ)を組み合わせたテクニカル分析ツールです。相場の波動(スイング)とそのスイングを形成するためにどれだけの出来高が投入されたかを視覚的に捉えることで、トレンドの強弱や転換の可能性を評価するのに役立ちます。
主な機能
ギャンスイングの描画:
相場の高値と安値を基に、上昇スイングと下降スイングを自動で識別し、ラインで結んで表示します。
これにより、市場の基本的な構造やトレンドの方向性を直感的に把握できます。
上昇スイングは緑色、下降スイングは赤色(デフォルト設定)で表示され、現在進行中のスイングはリアルタイムで描画され続けます。
ワイスウェーブ出来高の表示:
一つのスイング(波)が完了するごとに、そのスイングの始点から終点までの累計出来高を計算し、スイングの頂点(高値・安値)に表示します。
大きな価格変動(スイング)が出来高を伴っているか、あるいは出来高が乏しい中で価格だけが動いているかを判断する材料となります。
例1: 上昇スイングの価格幅が大きいにも関わらず出来高数値が小さい場合、その上昇の勢いが弱い可能性を示唆します。
例2: 価格の動きは小さいのに出来高数値が非常に大きい場合、強い抵抗や支持、あるいは市場の意見が対立している状況を示唆します。
現在進行中のスイングの累計出来高も、末尾に「_」を付けてリアルタイムで表示します。
出来高ローソク足の色付け:
オプションを有効にすると、各ローソク足の出来高を移動平均線(EMA)と比較し、その出来高の大きさに応じてローソク足を色付けします。
出来高が平均よりも大幅に大きい足は濃い色で表示され、市場の注目が集まっている価格帯(重要な高値・安値など)を特定するのに役立ちます。
設定項目(インプット)の解説
ギャンスイング設定:
ギャンスイングラインを表示: スイングラインの表示/非表示を切り替えます。
線の太さ: ラインの太さを調整します。
上昇スイング/下降スイング: 各スイングラインの色を自由に設定できます。
出来高数値の設定:
出来高数値を表示: スイングごとの累計出来高の表示/非表示を切り替えます。
上昇出来高/下降出来高: 出来高数値のテキスト色を自由に設定できます。
サイズ: 出来高数値の文字サイズを選択できます。
出来高の単位: 出来高の数値をそのまま表示するか、「K」(千)、「M」(百万)、「B」(十億)単位に変換して表示するかを選択できます。
追加の視覚設定:
出来高ローソク足を表示: 出来高に応じたローソク足の色付け機能の有効/無効を切り替えます。
出来高EMA期間: ローソク足の色付けの基準となる出来高移動平均線の期間を設定します。
活用方法
このインジケーターは、単独で使うだけでなく、他のテクニカル指標と組み合わせることで、より精度の高い分析が可能になります。
トレンドの確認: 価格が上昇スイングを続けており、かつ各上昇スイングの出来高が増加傾向にあれば、強い上昇トレンドと判断できます。
トレンド転換の察知: 価格は新高値を更新しているのに、上昇スイングの出来高が前回よりも著しく減少している場合(ダイバージェンス)、上昇の勢いが尽きかけており、トレンド転換が近い可能性を示唆します。
重要な価格帯の特定: 出来高ローソク足機能で色が濃くなっている価格帯は、多くの市場参加者が取引したことを意味し、将来的にサポート(支持)やレジスタンス(抵抗)として機能する可能性があります。
Script protegido
Este script se publica como código cerrado. No obstante, puede utilizarlo libremente y sin ninguna limitación. Obtenga más información aquí.
Exención de responsabilidad
La información y las publicaciones no constituyen, ni deben considerarse como asesoramiento o recomendaciones financieras, de inversión, de trading o de otro tipo proporcionadas o respaldadas por TradingView. Más información en Condiciones de uso.