Robust Scaled HMA | Oquant
The Robust Scaled HMA is an indicator designed to provide a more resilient trend-following signal by combining the Hull Moving Average (HMA) with a robust scaling mechanism based on interquartile range (IQR). Unlike traditional scaled indicators that rely on standard deviation, which can be skewed by outliers in volatile markets, this approach uses quartiles to normalize the HMA values, offering better resistance to extreme price movements. It generates long and short signals based on user-defined thresholds and includes built-in performance metrics to evaluate the indicator's historical behavior, alongside buy-and-hold comparisons(Remember past performance doesn’t guarantee future results). This allows traders to assess potential effectiveness without needing external backtesting tools(Remember past performance doesn’t guarantee future results). The indicator is particularly useful for those seeking a balance between responsiveness and robustness in trend detection, and it visualizes allocation states (LONG, SHORT, or CASH) through color-coded plots and optional tables.
Key Factors/Components
Robust Scaling: Employs IQR for normalization instead of standard deviation, reducing sensitivity to outliers and providing a more stable measure of deviation from the median HMA.
Signal Generation: Threshold-based triggers for long (above upper threshold) and short (below lower threshold) positions, with options to enable/disable longs or shorts to suit directional biases.
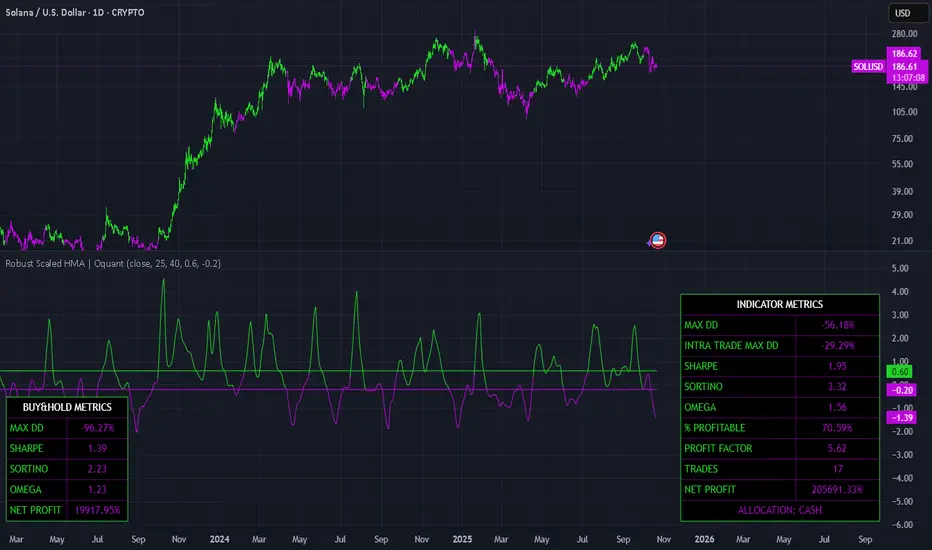
Performance Metrics: Calculates key risk-adjusted metrics such as Maximum Drawdown (Max DD), Intra-Trade Max DD, Sharpe Ratio, Sortino Ratio, Omega Ratio, Percent Profitable, Profit Factor, Total Trades, and Net Profit for the indicator's signals.
Buy-and-Hold Comparison: Displays equivalent metrics for a simple buy-and-hold approach on the same asset and timeframe for benchmarking.
Visualization Tools: Color-coded plot of the scaled HMA, threshold lines, optional equity curve, bar coloring, and customizable tables for metrics and allocation status.
Alert Conditions: Built-in alerts for bullish (crossover to long) and bearish (crossunder to short) signals.
How It Works
The indicator starts by computing a standard HMA on the selected source. It then applies robust scaling over a lookback period by subtracting the median HMA and dividing by the IQR (difference between the 75th and 25th percentiles), resulting in a normalized value that highlights deviations in a outlier-resistant manner. Signals are derived simply: values exceeding the upper threshold suggest upward momentum (long), while those below the lower threshold indicate downward momentum (short). The script simulates a basic equity curve by applying these signals to daily returns, holding long/short only when enabled, otherwise defaulting to cash (0% return). Metrics are computed on this equity curve using standard formulas—e.g., Sharpe as average return over standard deviation of returns (annualized), Sortino focusing on downside deviation, and Omega as the ratio of positive to negative returns. All calculations begin from the user-specified start date to ensure relevance to the tested period(Remember past performance doesn’t guarantee future results). This logic emphasizes robustness for real-world application.
For Who It Is Best/Recommended Use Cases
This indicator is best suited for traders focused on trend-following strategies in markets prone to volatility or outliers. Recommended use cases include:
Trend Identification: As a filter for entering/exiting positions.
Strategy Evaluation: Quickly assessing signal quality through integrated metrics without complex backtesting setups(Remember past performance doesn’t guarantee future results).
Customization: Adjusting for bullish biases by disabling shorts, or vice versa, in one-sided markets.
Settings and Default Settings
Start Date: Timestamp for when calculations begin (default: 1 Jan 2018).
Source: Price series for HMA calculation (default: close).
HMA Length: Period for the Hull Moving Average (default: 25).
Robust Scaling Length: Lookback for robust scaling calculations (default: 40).
Upper Threshold: Level above which long signals trigger (default: 0.6).
Lower Threshold: Level below which short signals trigger (default: -0.2).
Allow Long Trades: Enables long positions; if disabled, defaults to cash (default: true).
Allow Shorts: Enables short positions; if disabled, defaults to cash (default: false).
Show Indicator Metrics Table: Displays table with strategy metrics (default: true).
Show Buy&Hold Table: Displays table with asset benchmarks (default: true).
Plot Equity Curve: Shows the simulated equity line (default: false).
Defaults are tuned for general use.
Conclusion
The Robust Scaled HMA offers a fresh take on trend detection by prioritizing robustness through IQR scaling, making it a valuable addition for traders aiming to navigate noisy markets with metrics-backed insights(Remember past performance doesn’t guarantee future results).
⚠️ Disclaimer: This indicator is intended for educational and informational purposes only. Trading/investing involves risk, and past performance does not guarantee future results. Always test and evaluate indicators/strategies before applying them in live markets. Use at your own risk.
Script que requiere invitación
Solo los usuarios autorizados por el autor pueden acceder a este script. Tendrá que solicitar y obtener permiso para utilizarlo. Normalmente se concede previo pago. Para obtener más información, siga las instrucciones del autor o póngase en contacto directamente con oquant.
TradingView NO recomienda pagar o utilizar un script a menos que confíe plenamente en su autor y entienda cómo funciona. También puede encontrar alternativas gratuitas de código abierto en nuestros scripts de la comunidad.
Instrucciones del autor
oquantsystems.com
Exención de responsabilidad
Script que requiere invitación
Solo los usuarios autorizados por el autor pueden acceder a este script. Tendrá que solicitar y obtener permiso para utilizarlo. Normalmente se concede previo pago. Para obtener más información, siga las instrucciones del autor o póngase en contacto directamente con oquant.
TradingView NO recomienda pagar o utilizar un script a menos que confíe plenamente en su autor y entienda cómo funciona. También puede encontrar alternativas gratuitas de código abierto en nuestros scripts de la comunidad.
Instrucciones del autor
oquantsystems.com