OPEN-SOURCE SCRIPT
Moving average to price cloud
Hi all!
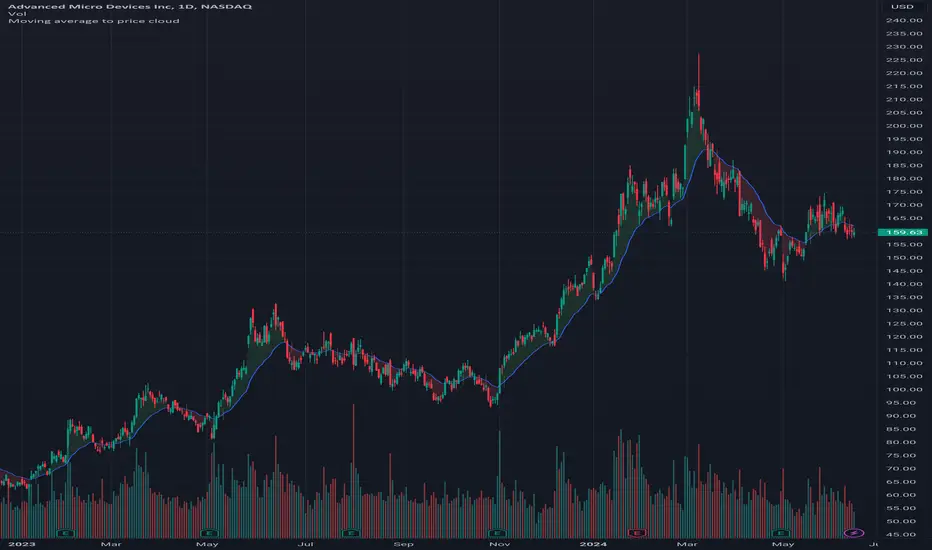
This indicator shows when the price crosses the defined moving average. It plots a green or red cloud (depending on trend) and the moving average. It also plots an arrow when the trend changes (this can be disabled in 'style'->'labels' in the settings).
The moving average itself can be used as dynamic support/resistance. The trend will change based on your settings (described below). By default the trend will change when the whole bar is above/below the moving average for 2 bars (that's closed). This can be changed by "Source" and "Bars".
Settings
• Length (choose the length of the moving average. Defaults to 21)
• Type (choose what type of moving average).
- "SMA" (Simple Moving Average)
- "EMA" (Exponential Moving Average)
- "HMA" (Hull Moving Average)
- "WMA" (Weighted Moving Average)
- "VWMA" (Volume Weighted Moving Average)
- "DEMA" (Double Exponential Moving Average)
Defaults to"EMA".
• Source (Define the price source that must be above/below the moving average for the trend to change. Defaults to 'High/low (passive)')
- 'Open' The open of the bar has to cross the moving average
- 'Close' The close of the bar has to cross the moving average
- 'High/low (passive)' In a down trend: the low of the bar has to cross the moving average
- 'High/low (aggressive)' In a down trend: the high of the bar has to cross the moving average
• Source bar must be close. Defaults to 'true'.
• Bars (Define the number bars whose value (defined in 'Source') must be above/below the moving average. All the bars (defined by this number) must be above/below the moving average for the trend to change. Defaults to 2.)
Let me know if you have any questions.
Best of trading luck!
Script de código abierto
Fiel al espíritu de TradingView, el creador de este script lo ha convertido en código abierto, para que los traders puedan revisar y verificar su funcionalidad. ¡Enhorabuena al autor! Aunque puede utilizarlo de forma gratuita, recuerde que la republicación del código está sujeta a nuestras Normas internas.
Exención de responsabilidad
La información y las publicaciones no constituyen, ni deben considerarse como asesoramiento o recomendaciones financieras, de inversión, de trading o de otro tipo proporcionadas o respaldadas por TradingView. Más información en Condiciones de uso.