OPEN-SOURCE SCRIPT
Actualizado [MAD] Self-Optimizing RSI
Overview
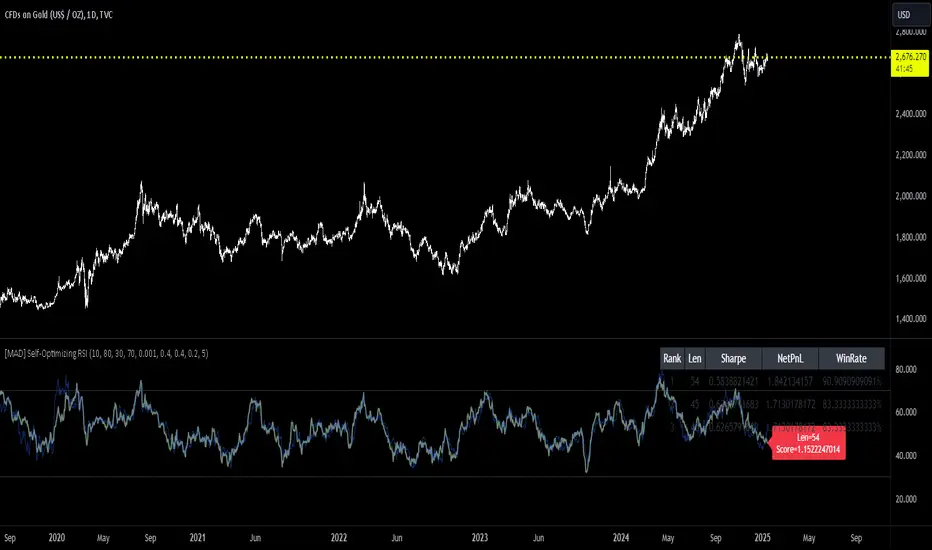
This script evaluates multiple RSI lengths within a specified range, calculates performance metrics for each, and identifies the top 3 configurations based on a custom scoring system. It then plots the three best RSI curves and optionally displays a summary table and label.
How It Works
The script calculates a custom RSI for each length in the [Min RSI Length .. Max RSI Length] range.
It simulates entering a long position when RSI crosses below the Buy Value and exits when RSI crosses above the Sell Value.
Each trade's return is stored in the relevant StatsContainer.
Metrics Computation
After all bars have been processed,
* Net Profit,
* Sharpe Ratio, and
* Win Rate
are computed for each RSI length.
A weighted score is then derived using the input weights.
Top 3 Identification
The script finds the three RSI lengths with the highest scores.
The RSI lines for these top 3 lengths are plotted in different colors.
If enabled, a table listing the top 3 results (Rank, RSI length, Sharpe, NetPnL, Win Rate) is shown.
If enabled, a label with the highest-scoring RSI length and its score is placed on the final bar.
Usage Tips
Adjust Min RSI Length and Max RSI Length to explore a narrower or wider range of periods.
Be aware, to high settings will slow down the calculation.
Experiment with different RSI Buy Value and RSI Sell Value settings if you prefer more or fewer trade signals.
Confirm that Min Trades Required aligns with the desired confidence level for the computed metrics.
Modify Weight: Sharpe, Weight: NetProfit, and Weight: WinRate to reflect which metrics are most important.
Troubleshooting
If metrics remain - or NaN, confirm enough trades (Min Trades Required) have occurred.
If no top 3 lines appear, it could mean no valid trades were taken in the specified range, or the script lacks sufficient bars to calculate RSI for some lengths. In this case set better buyvalue and sellvalues in the inputs
Disclaimer
Past performance is not indicative of future results specialy as this indicator can repaint based on max candles in memory which are limited by your subscription
Notas de prensa
Typo in the table, thx for notifyingScript de código abierto
Fiel al espíritu de TradingView, el creador de este script lo ha convertido en código abierto, para que los traders puedan revisar y verificar su funcionalidad. ¡Enhorabuena al autor! Aunque puede utilizarlo de forma gratuita, recuerde que la republicación del código está sujeta a nuestras Normas internas.
telegram - @djmad_0815
Exención de responsabilidad
La información y las publicaciones no constituyen, ni deben considerarse como asesoramiento o recomendaciones financieras, de inversión, de trading o de otro tipo proporcionadas o respaldadas por TradingView. Más información en Condiciones de uso.
Script de código abierto
Fiel al espíritu de TradingView, el creador de este script lo ha convertido en código abierto, para que los traders puedan revisar y verificar su funcionalidad. ¡Enhorabuena al autor! Aunque puede utilizarlo de forma gratuita, recuerde que la republicación del código está sujeta a nuestras Normas internas.
telegram - @djmad_0815
Exención de responsabilidad
La información y las publicaciones no constituyen, ni deben considerarse como asesoramiento o recomendaciones financieras, de inversión, de trading o de otro tipo proporcionadas o respaldadas por TradingView. Más información en Condiciones de uso.