OPEN-SOURCE SCRIPT
Actualizado Volatility Adjusted Momentum Signal ETH (VAMS)
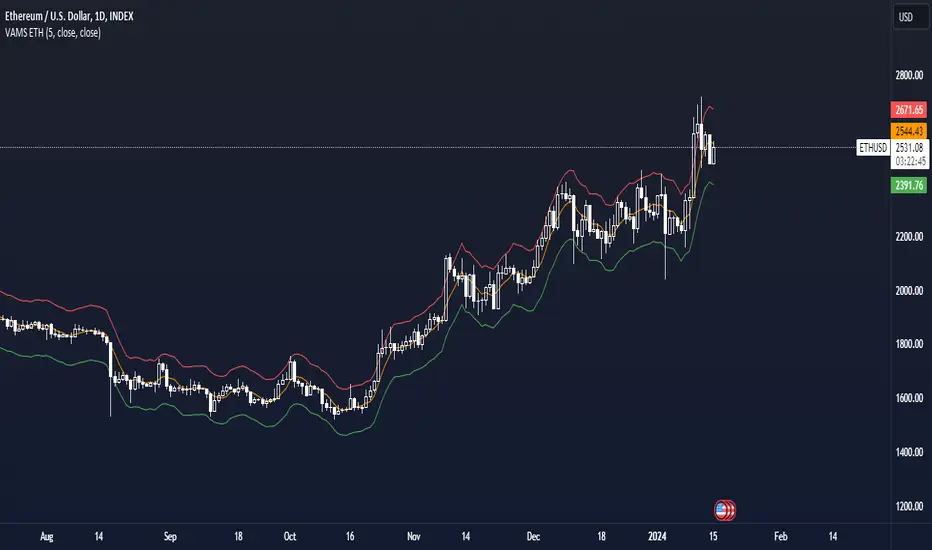
The VAMS ETH indicator is a technical analysis tool designed for Ethereum that aims to provide traders with insights into potential price momentum based on volatility-adjusted price ranges. This indicator is especially useful for identifying periods where the price is likely to experience significant movements away from a defined mean price level.
Key Functions
Volatility Measurement It utilizes a short-term lookback period to measure volatility, calculated as the standard deviation of the closing prices over the user-defined period.
Mean Price Calculation
Simultaneously, it computes the average closing price over the same lookback period to establish a baseline for the current price.
Probable Range Estimation
Using predefined mean percentage changes, the indicator calculates upper and lower boundaries that represent the probable range for price movements. These boundaries are adjusted for volatility, providing a dynamic perspective on where the price is in relation to typical fluctuations.
Signal Visualization
The lower and upper boundaries are plotted on the chart, color-coded in green and red, respectively. These plots help visualize zones where the price might be considered overextended or undervalued based on recent volatility.
The VAMS indicator allows for customization of the lookback period, enabling traders to adjust the sensitivity of the volatility measurement to match their trading style.
Notas de prensa
Added plot for the mean priceAdded input for the source of the mean price and volatility
Notas de prensa
Cleaned script codeScript de código abierto
Fiel al espíritu de TradingView, el creador de este script lo ha convertido en código abierto, para que los traders puedan revisar y verificar su funcionalidad. ¡Enhorabuena al autor! Aunque puede utilizarlo de forma gratuita, recuerde que la republicación del código está sujeta a nuestras Normas internas.
🔍 Access Investing Strategies & Indicators
📊 whop.com/marktquant
🌐 marktquant.com
Nothing shared on this page constitutes financial advice. All information, tools, and analyses are provided solely for informational and educational purposes.
📊 whop.com/marktquant
🌐 marktquant.com
Nothing shared on this page constitutes financial advice. All information, tools, and analyses are provided solely for informational and educational purposes.
Exención de responsabilidad
La información y las publicaciones no constituyen, ni deben considerarse como asesoramiento o recomendaciones financieras, de inversión, de trading o de otro tipo proporcionadas o respaldadas por TradingView. Más información en Condiciones de uso.
Script de código abierto
Fiel al espíritu de TradingView, el creador de este script lo ha convertido en código abierto, para que los traders puedan revisar y verificar su funcionalidad. ¡Enhorabuena al autor! Aunque puede utilizarlo de forma gratuita, recuerde que la republicación del código está sujeta a nuestras Normas internas.
🔍 Access Investing Strategies & Indicators
📊 whop.com/marktquant
🌐 marktquant.com
Nothing shared on this page constitutes financial advice. All information, tools, and analyses are provided solely for informational and educational purposes.
📊 whop.com/marktquant
🌐 marktquant.com
Nothing shared on this page constitutes financial advice. All information, tools, and analyses are provided solely for informational and educational purposes.
Exención de responsabilidad
La información y las publicaciones no constituyen, ni deben considerarse como asesoramiento o recomendaciones financieras, de inversión, de trading o de otro tipo proporcionadas o respaldadas por TradingView. Más información en Condiciones de uso.