OPEN-SOURCE SCRIPT
Cumulative Net Volume
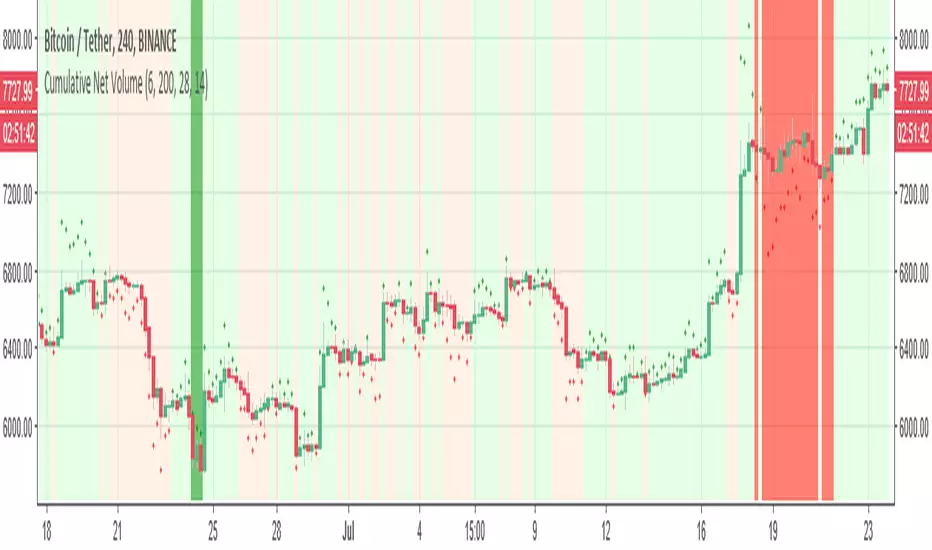
This indicator calculate the Cumulative Net Volume (volume in versus volume out) as seen in red and green cross
I normalize it to be as price indicator -then using color setting it easy to see when volume influx is positive compare to negative period
next step -I add rsi and Bollinger to highlight the area where volume is going up or down with the best period by rsi and Bollinger (green red)
it easy indicator for starter to see where the best buy or sell point
have fun
Script de código abierto
Fiel al espíritu de TradingView, el creador de este script lo ha convertido en código abierto, para que los traders puedan revisar y verificar su funcionalidad. ¡Enhorabuena al autor! Aunque puede utilizarlo de forma gratuita, recuerde que la republicación del código está sujeta a nuestras Normas internas.
Exención de responsabilidad
La información y las publicaciones no constituyen, ni deben considerarse como asesoramiento o recomendaciones financieras, de inversión, de trading o de otro tipo proporcionadas o respaldadas por TradingView. Más información en Condiciones de uso.