INVITE-ONLY SCRIPT
Mayfair Supply & Demand Zones 1.0

Identifying Supply and Demand zones can be tricky.
Just using price levels can mislead you, so why not include volume ramps to detect zones?
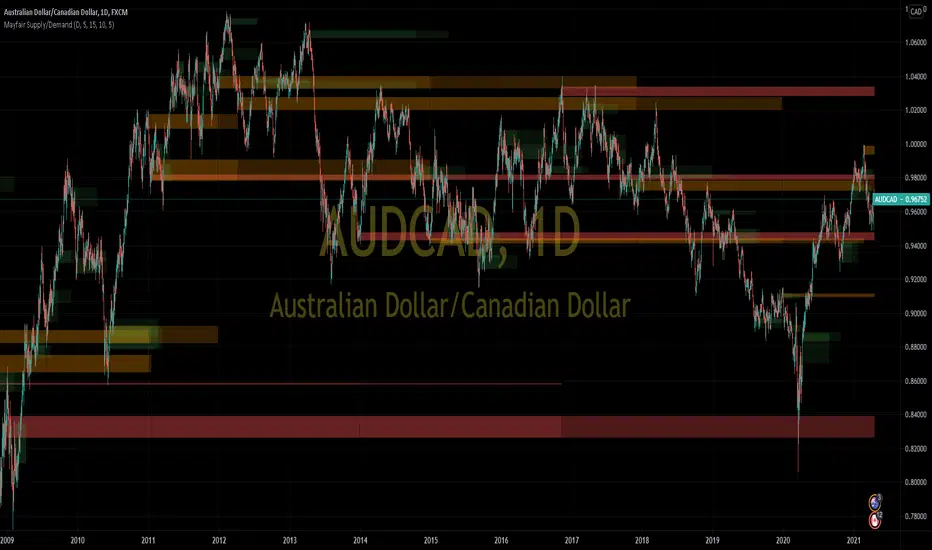
This indicator does it for you. It spots areas where volume has rapidly increased, measures the speed of the increase, and assigns three different levels of importance.
The red areas are the strongest zones, followed by amber, then green, like a traffic light.
The red areas are persisted longer than the amber, which are persisted longer than the green. As the persistence fades, the colour of the zone fades as well.
It is possible to set the levels of all three volume thresholds to suit yourself, as well as the lookback period the script uses to detect volume increases.
In this chart, only very large volume increases are used:

As you can see, the bands are narrower, but we feel the defaults give the best results.
Just using price levels can mislead you, so why not include volume ramps to detect zones?
This indicator does it for you. It spots areas where volume has rapidly increased, measures the speed of the increase, and assigns three different levels of importance.
The red areas are the strongest zones, followed by amber, then green, like a traffic light.
The red areas are persisted longer than the amber, which are persisted longer than the green. As the persistence fades, the colour of the zone fades as well.
It is possible to set the levels of all three volume thresholds to suit yourself, as well as the lookback period the script uses to detect volume increases.
In this chart, only very large volume increases are used:
As you can see, the bands are narrower, but we feel the defaults give the best results.
Script que requiere invitación
El acceso a este script está restringido a los usuarios autorizados por el autor y, por regla general, es de pago. Puede añadirlo a sus favoritos, pero solo podrá usarlo si solicita permiso al autor y éste le autoriza. Para obtener más información, póngase en contacto con Paul_Varcoe o siga las siguientes instrucciones del autor.
TradingView recomienda no comprar ni utilizar un script si su autor no le ofrece total confianza o cuando no entienda cómo funciona. En muchos casos, puede encontrar una buena alternativa de código abierto de forma gratuita en nuestros Scripts de la comunidad.
Instrucciones del autor
″To buy this script please go to https://launchpass.com/mayfair-trading-and-mentoring/supply-and-demand
The script is quite CPU heavy, so it's best to hide it temporarily when scrolling or otherwise moving the chart
¿Quiere utilizar este script en un gráfico?
Advertencia: Por favor, leer antes de solicitar acceso.
Exención de responsabilidad
La información y las publicaciones que ofrecemos, no implican ni constituyen un asesoramiento financiero, ni de inversión, trading o cualquier otro tipo de consejo o recomendación emitida o respaldada por TradingView. Puede obtener información adicional en las Condiciones de uso.