OPEN-SOURCE SCRIPT
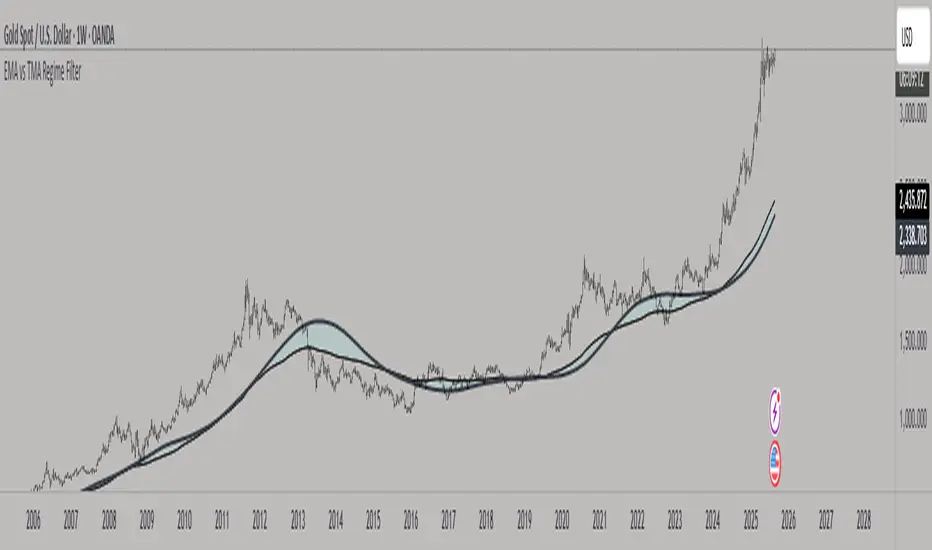
EMA vs TMA Regime Filter
EMA vs TMA Regime Filter
This indicator is built as a visual study tool to compare the behavior of the Exponential Moving Average (EMA) and the Triangular Moving Average (TMA).
The EMA applies an exponential weighting to price data, giving stronger importance to the most recent values. This makes it a faster, more responsive line that reflects short-term momentum. The TMA, by contrast, applies a double-smoothing process (or in the “True TMA” option, a split SMA sequence), which produces a much slower curve. The TMA emphasizes balance over reactivity, often used for filtering noise and observing longer-term structure.
When both are plotted on the same chart, their differences become clear. The shaded region between them highlights times when short-term price dynamics diverge from longer-term smoothing. This is where the idea of “regime” comes in — not as a trading signal, but as a descriptive way of seeing whether market action is currently dominated by speed or by stability.
Users can customize:
The goal is not to create a system, but to help traders experiment, observe, and learn how different smoothing techniques can emphasize different aspects of price. By switching between the legacy and true TMA, or adjusting lengths, users can study how each approach interprets the same data differently.
This indicator is built as a visual study tool to compare the behavior of the Exponential Moving Average (EMA) and the Triangular Moving Average (TMA).
The EMA applies an exponential weighting to price data, giving stronger importance to the most recent values. This makes it a faster, more responsive line that reflects short-term momentum. The TMA, by contrast, applies a double-smoothing process (or in the “True TMA” option, a split SMA sequence), which produces a much slower curve. The TMA emphasizes balance over reactivity, often used for filtering noise and observing longer-term structure.
When both are plotted on the same chart, their differences become clear. The shaded region between them highlights times when short-term price dynamics diverge from longer-term smoothing. This is where the idea of “regime” comes in — not as a trading signal, but as a descriptive way of seeing whether market action is currently dominated by speed or by stability.
Users can customize:
- Line styles, widths, and colors.
- Cloud transparency for visual clarity.
- Whether to color bars based on relative position (optional, purely visual).
The goal is not to create a system, but to help traders experiment, observe, and learn how different smoothing techniques can emphasize different aspects of price. By switching between the legacy and true TMA, or adjusting lengths, users can study how each approach interprets the same data differently.
Script de código abierto
Fiel al espíritu de TradingView, el creador de este script lo ha convertido en código abierto, para que los traders puedan revisar y verificar su funcionalidad. ¡Enhorabuena al autor! Aunque puede utilizarlo de forma gratuita, recuerde que la republicación del código está sujeta a nuestras Normas internas.
Exención de responsabilidad
La información y las publicaciones no constituyen, ni deben considerarse como asesoramiento o recomendaciones financieras, de inversión, de trading o de otro tipo proporcionadas o respaldadas por TradingView. Más información en Condiciones de uso.