OPEN-SOURCE SCRIPT
0.382 Fibonacci Line of Trailing 1-year Price Range
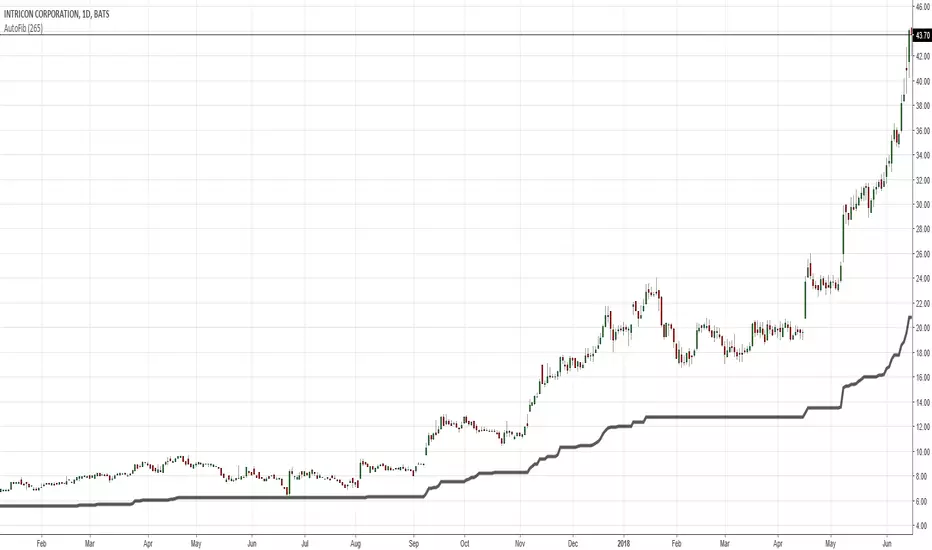
You may try adding this Line to your daily charts. It represents the 0.382 Fibonacci level of the trailing 1-year Price Range.
If price is above this line, then it is in Bullish Territory and long entries can be looked for.
According to backtesting I've done, price being above the 0.382 Fibonacci and/or the 200d sma are the 2 best determinants of
qualifying an equity to be in Bullish Territory on the daily chart.
If price is above this line, then it is in Bullish Territory and long entries can be looked for.
According to backtesting I've done, price being above the 0.382 Fibonacci and/or the 200d sma are the 2 best determinants of
qualifying an equity to be in Bullish Territory on the daily chart.
Script de código abierto
Fiel al espíritu de TradingView, el creador de este script lo ha convertido en código abierto, para que los traders puedan revisar y verificar su funcionalidad. ¡Enhorabuena al autor! Aunque puede utilizarlo de forma gratuita, recuerde que la republicación del código está sujeta a nuestras Normas internas.
Exención de responsabilidad
La información y las publicaciones no constituyen, ni deben considerarse como asesoramiento o recomendaciones financieras, de inversión, de trading o de otro tipo proporcionadas o respaldadas por TradingView. Más información en Condiciones de uso.