BTC/USD 10009.7 in 12h/8h?? (English and Spanish) (TimeFrame:4h)EN:
There was an error in the calculation of the angle of the trend line of the previous projection, that was what gave us the estimated time to reach 10k. As we notice a difference of 8 °, we estimate a new time to meet the 10k objective and even go through it and we position ourselves between 12 and 8 hours from the moment of this publication.
IMPORTANT NOTICE: These analyzes are for those who already have their bitcoins in the market. If you still do not have it, wait for the markets and indicators to cool a bit, there is a chance that bitcoin will correct in some time. However, I think that if we break the 10k barrier, that would be a good buying opportunity since the market will go into a state of alert and may increase its price in a very important way.
ES:
Hubo un error en el cálculo del ángulo de la línea de tendencia de la proyección anterior, que fue lo que nos dio el tiempo estimado para llegar a 10k. Como notamos una diferencia de 8 °, estimamos un nuevo tiempo para cumplir con el objetivo de 10k e incluso pasar por él y nos posicionamos entre 12 y 8 horas desde el momento de esta publicación.
AVISO IMPORTANTE: Estos análisis son para aquellos que ya tienen sus bitcoins en el mercado. Si aún no lo tiene, espere a que los mercados y los indicadores se enfríen un poco, existe la posibilidad de que bitcoin corrija en algún momento. Sin embargo, creo que si rompemos la barrera de los 10k, sería una buena oportunidad de compra, ya que el mercado entraría en estado de alerta y puede aumentar su precio de una manera muy importante.
Buscar en ideas para "INDICATORS"

Pattern of ema 24 crossing ema 200 (golden cross) in bitcoinWe can see a pattern during the crosses of the ema 24 over the ema 2000 during the last 8 - 9 years at bitcoin. As the price-auction in bitcoin is relatively small the confirmation of the pattern is difficult to confirm. As you can observe over the last 9 years we had 10 crosses. December 11 of 2011 ( As I don't have previous data I can't say wath it is), March 14 of 2012 (first cross and fake out), April 16 of 2012 ( second cross and fake out), May 19 of 2012 (third cross, and bull run), May 30 of 2014 (first cross and fake out), July 21 of 2015 (second cross and fake out) October 25 of 2015 ( third cross and bull run of 2017), February 14 of 2018 ( first cross, in some charts we didn't crossed), May 3 of 2018 (second or first cross, fake out) and April 14 of 2019 (second or third cross).
Every two crosses following a bull run will be fakes. The purpose of these crosses are to cool off the ema 200 and the ma 200. Both indicators have importance in crypto as they indicate the cycle between the bear and the bull market. If the ma 200 is over the ema 200 it is bearish but if the ema 200 is over the ma 200 we have there a bullish signal. As boths are hyperbolic you need to reach an equilibrium between the phases that is what the crossing pattern of the ema 24 over the ema 200 shows. To reach the equilibrium from the previous bull market the ema 24 needs to cross over the ema 200 twice before a new cross to start the bull cycle. And the bear market is followed by then two (dead cross) crossing of the ema 24 under the ema 200. During the last bear market these occured twice: March 25 of 2018 (btc price was 8400$) and May 17 of 2018 (btc price was 7900$).
It is possible because of the extension of the bull market the bear market this time will have 3 fake out. One reason is maybe the cross of february 14 of 2018 that is not showed in every charts.

SPY: critical levels to watch in the coming days
While some traders argue that we entered into a new stage since Chairman Powell hopefully is now by our side (bullish side), some analyst argue that the macroeconomic data hasn’t improved and that should keep us at least cautious about how markets will behave, taking into account that FED’s rate is not the only variable that matters to markets.
Having said that, now let’s take a look at some key indicators, which hopefully will be a guidance for the days ahead.
After a really good start of the year, the SPY rally that begun late December, it is finally showing signs of exhaustion. During the January and February rally, the SPY was able to close on its daily chart above its 9EMA every single day (ignoring one day at early January while it was consolidating), showing strength for the days ahead. Nevertheless, on last March 6th showed some weakness after closing for the first time after almost two months below its 9EMA. After that, it went straight to its daily 200SMA (around 275), before falling further to 272 levels, where it was able to found some buying force.
If we look back to October/2018, the SPY, after finish with its almost 6 months rally, retraced on its weekly chart until its 50SMA, level who provided some support before bounce to its daily 9EMA, level which was subsequently sold opening the doors to further losses.
After that, the SPY ranged between 260 and 280, being the upper level its daily 100sma, which became a resistance for at least 3 times.
Coming back to these days, the SPY, after failed to defend both its daily 9EMA and its daily 200SMA, closed the week with a considerable size red weekly candle, which by the way showed some buying force again on its weekly 50SMA.
So what’s next? I certainly don’t know, but after a red weekly close, traders must be cautions before start “buying the dip”, as it is likely that this week’s dip, won’t be the the last one.
My base scenario for the coming days is a bounce continuation until we reach the daily 9EMA, level which have been sold on previous ocations after being violated. After that, I am looking for a retracement to its daily 100SMA, level which is also very close to daily 50SMA.
It makes sense to me that the daily 100SMA which previously was a key resistance level, now it may be a support for the markets, contributing to the bullish narrative for the months ahead.
Hope you find useful this information.
Keep calm and trade safe.
Cheers,
Arturo Pineda

The Big Crash SPX ! Most indicators anticipate the Big Crash, I'd might be wrong, but this is my advise.


BTC- ¿End of WXY complex correction? (¿Final de la corrección?)The BTC is completing a correction (WXY) in a triangle (ABCDE). In this case we are waiting for E where we can see possible rise of the BTC made new maximum, there are also possibilities that this complex correction will be longer. Undoubtedly point (E) will be a very expected point for investors and institutions.
The point (E): You can get it in levels from 5,000 to 4,200
To consider: remember that the 5,800 levels have worked as a support and pivot point of alpha effectiveness.
Regarding losses: Cryptocurrency is very volatile, you should consider placing short S / L if it operates at 4,200 levels. However, depending on their level of risk the BTC can generate very long candle wicks in these levels of (E) that can activate their S / L if they are very tight. If you do not want to take a chance, you should wait to confirm that point (E) has ended
Pay attention: There is a blue trend line that comes from the beginning of the rise of the BTC, has been respected very well, is a very important support that could give us more aggressive rebounds and not respect this analysis.
What about the EMA-200-1D? The EMA-1D seems to be helping this ABCD pattern to be fulfilled perfectly, we should be very attentive to a consolidation of the price above of the EMA-1D, but at the moment we can only perceive the EMA-1D as a resistance.
Regarding RSI-1D: You can see a small difference in amount, but it is better that you do not rush and wait for the price to decide. The best thing is to look for a clearer divergence in case the price reaches 4.200, surely you will find it and this will help you to make a calmer decision in the middle of big sales of panic.
CAUTION: In case the price strongly breaks levels of 4,200 if you use exchange, the best thing is that you observe, you could send the price to levels of 2,400. This is an apocalyptic scenario of very low probability (5% or 10%), but respect the rules of the pattern (WXY), remember that the BTC always surprises in all senses.
How far could the price go?: It's a good question, but the market is the one who decides and I would not get ahead of the T / P, since point (E) could break in a Zig-Zag for a more extensive correction or in a 5-wave impulse for also a more extensive correction or a definitive change of tendency. But undoubtedly your T / P can place them at levels 5,800, 6800 and 7,200 while trying to interpret where the market is going. You should be very attentive to the price force and news related to the BTC as it will give you to talk to both investors and institutions if it bounces at point (E).
ALWAYS REMEMBER: The BTC that always fills us with surprises may the price change trend now and go to find new highs, as it may not. The analyzes are based on probabilities and due to the market sentiment, indicators and news, I propose this analysis as the probability with the highest percentage of success. REMEMBER THAT THE FUTURE IS UNCERTAIN AND THAT WE ALWAYS OPERATE BASED ON PROBABILITIES.
Patience is the key
El BTC se encuentra terminando una corrección (WXY) en un triangulo (ABCDE). En este caso estamos esperando E donde podremos ver posible alza del BTC hacía nuevos máximo, también hay posibilidades de que esta corrección compleja se alargue mas. Sin duda alguna el punto (E) será un punto muy esperado para los inversionistas e instituciones.
El punto (E): Usted podrá conseguirlo en niveles desde los 5.000 hasta los 4.200
A considerar: recordar que los niveles de 5.800 han funcionando como un soporte y punto pivote de alfa efectividad.
En cuanto a perdidas: Las criptodivisas son muy volátiles, usted debe considerar colocar S/L cortos si opera en niveles de 4.200. No obstante dependiendo de su nivel de riesgo el BTC puede generar mechas de velas muy largas en estos niveles de (E) que pueden activar sus S/L si son muy ajustados. Si usted no quiere arriesgarse deberá esperar la confirmar que el punto (E) ha finalizado
Prestar atención: Hay una linea de tendencia azul que viene des los inicios del alza del BTC, se ha respetado muy bien, es un soporte muy importante que podría darnos rebotes mas agresivos y no respetar este análisis.
¿Que hay de la EMA-200-1D? La EMA-1D parece estar ayudando a que este patrón ABCD se cumpla a la perfección, deberíamos estar muy atentos a una consolidación del precio por encima de la EMA-1D, pero de momento solo podemos percibir la EMA-1D como una resistencia.
En cuanto a RSI-1D: De monto se pueden apreciar una pequeña divergencia, pero es mejor que usted usted no se apresure y espere que el precio sea quien decida. Lo mejor es buscar una divergencia mas clara en caso de que el precio llegue a 4.200, de seguro la encontrará y esta le ayudara a tomar un decisión mas calmada en medio de grandes ventas de pánico.
PRECAUCIÓN: En caso de que el precio rompa con fuerza niveles de 4.200 si usted utiliza exchange lo mejor es que observe, podría enviar el precio a niveles de 2.400. Este es un escenario apocalíptico de muy baja probabilidad (5% o 10%), pero respeta las reglas del patrón (WXY), recordar que el BTC siempre sorprende en todos los sentidos.
¿Hasta donde podría llegar el precio?: Es una buena pregunta, pero el mercado es quien decide y por ellos no me adelantaría a los T/P, ya que el punto (E) podría romper en un Zig-Zag para una corrección mas extensa o en un impulso de 5 ondas para también un corrección mas extensa o un cambio de tendencia definitivo. Pero sin duda alguna sus T/P puede colocarlos en niveles 5.800, 6800 y 7.200 mientras se intenta interpretar hacia donde va el mercado. Debería estar muy atento a la fuerza del precio y noticias relacionadas al BTC ya que dará de que hablar tanto a inversionistas como instituciones si rebota en el punto (E).
RECORDAR SIEMPRE: El BTC que siempre nos llena de sorpresas puede que el precio cambie de tendencia ahora mismo y vaya a buscar nuevos máximos, como puede que no. Los análisis se basan en probabilidades y debido a la sensación del mercado, indicadores y noticias planteo este análisis como la probabilidad con mas porcentaje de acierto. RECUERDE QUE EL FUTURO ES INCIERTO Y QUE SIEMPRE OPERAMOS EN BASE A LAS PROBABILIDADES.
La paciencia es la clave
HITBTC:BTCUSD

xbt incoming pump?should we expect a third pump on this trade?
my conservative instinct says no.... but several indicators keep looking bullish
- swinging monkey pro is still marking a long since last friday with a very healhty central channel
- Donchian channels are on the uptrend on 1d charts
- BTC volume it looking beautiful, was at 10b 4 days ago, now it stands at 21b, we are talking 100% in 4 days,
- I thought yesterday pump was the end of a beautiful cup and handle pattern, but im not so sure anymore... current 1h chart its looking like a handle too...
just remember to be beware of stop loss busters, keep your leverage below 15x and dont take unnecessary risks


QTUM, the easiest way is BearishQTUM has responded positively such as most cryptos today and has gained $ 5.53% in the last 24 hours, however no significant increases are expected in the short term due to the low volume in the market since the technical indicators are showing overbought (Stochastic) and the RSI is undecided in the middle of the table at 54. If the price gains a little more value it will most likely visit the upper part of the Bollinger band to bounce there, the 200 and 100 EMA periods are separating which indicates that the easiest way to go is bearish.

ADA Analysis for todayThe price of Cardano (ADA) reports 9.21% of gains in the last 24H and its current price is $ 0.1970. The price has bounced on the floor at $ 0.1706 and continues climbing and aproaching to the Bearish Trend Line that has a resistance at $ 0.2034. Despite the recovery, the pair continues its downward trend and its short-term outlook is continuation, the 100-EMA is still below the 200-EMA, this suggests lower resistance to the downside, also the separation between these two indicators is expanding more, this reflects a higher selling pressure. Buyers are already tired according to the Stochastic that shows signs of overbought so we can expect a rebound in the Bearish Trend Line.

IOTA great moment to buyAll the indicators including the volume tell us that a breakout is comming, charge some bags and enjoy the ride.

XLM FlyingHuge things coming for #stellarlumens this year.
Listed in more and more exchanges, scheduled summits, partnership with Novatti group, more adoption and inclusion in new wallets and currently working on integrate the lightning network in Q4.
Currently traded at 0.3672$ and have just hit an important resistance region area between 0.37$ and 0.42$. Moving with btc dynamics we can expect a retracement to 0.30-0.32$ area before continuing its bullish second leg trend. This would be a good area to accumulate more of it.
Technical indicators show overbought area and triple MA cross.


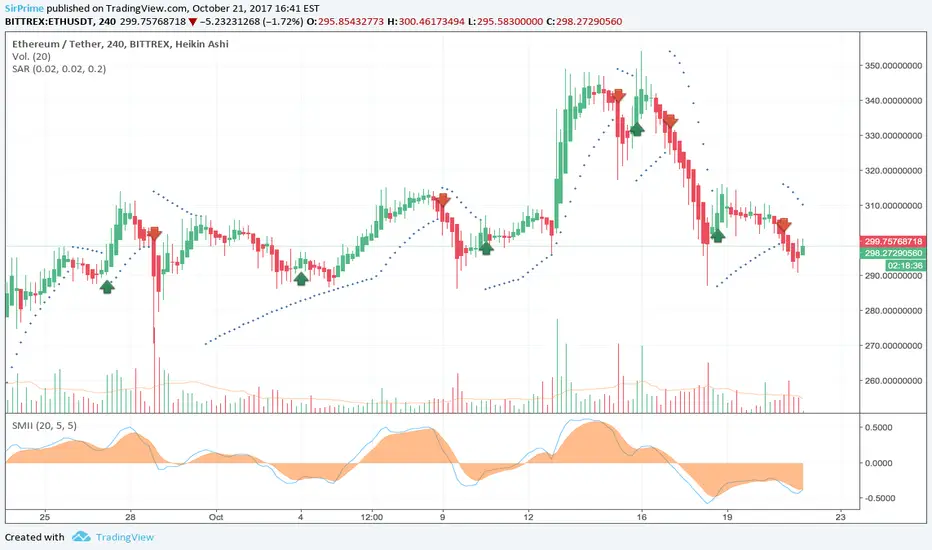
Buena estrategia? Heikin-Ashi, Parabolic SAR y SMI combinados.Están marcados algunos puntos en el gráfico Heikin-Ashi de ETHUSD, que hubiesen sido entradas cortas o largas en trading, utilizando una combinación de señales con el Parabolic SAR y el indicador ergódico. Qué te parece?
Podrás encontrar más información sobre estos indicadores en: Heikin Ashi , Parabolic SAR , SMI .