The Sell Signal That My Strategy Revealed 72 Hours EarlierAnalysis Timeframe: 1 Hour (H1).
The market experienced a significant (strong) move last Friday, October 10, 2025. This event was accurately anticipated by our trading methodology.
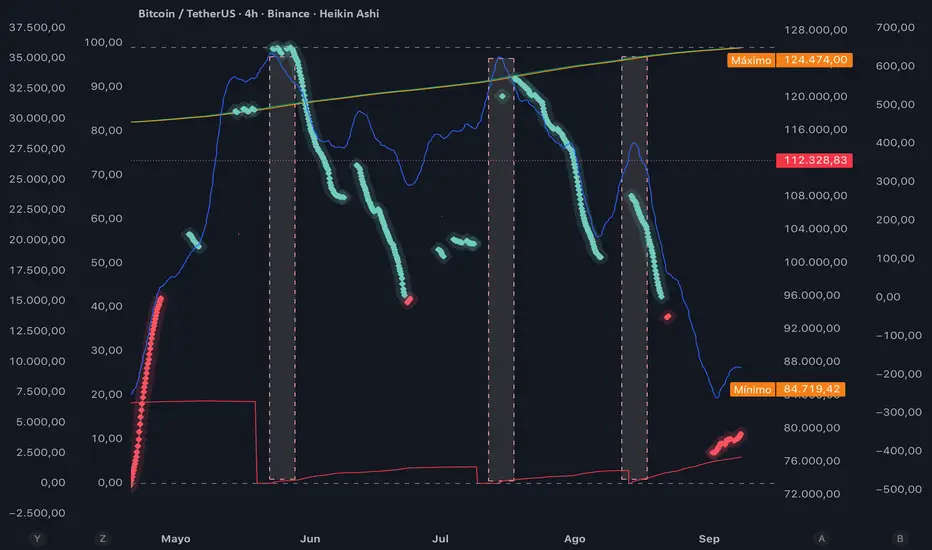
Alert: Since October 6th, the trading strategy we employ generated a clear signal indicating a high probability of a directional move downward (or sell/short).
The indicators and specific conditions that converged to validate the alert for this bearish movement are detailed below:
Indicator/Tool Detected Condition (Bearish/Sell Alert)
1- VRVP --GRAY ZONE
2- STOCH RSI --BLUE LINE AT EXTREMES
3- STOCH RSI --LINE AT EXTREMES AND LINE CROSSOVERS
4- ADX --WEAKNESS/STRENGTH AS APPROPRIATE
5- VOLUME --LOW FOR CURRENT MOVEMENT
6- MACD --HISTOGRAM DISPLAYED
/////////////0/0//////0//////////////////////////////////////////////0/////////////0//0/0////////////////////////0/0//
Marco Temporal de Análisis (Timeframe): 1 Hora (H1).
El mercado experimentó un movimiento significativo (fuerte) el pasado viernes 10 de Octubre 2025. Este evento fue anticipado con precisión por nuestra metodología de trading.
Alerta:Desde el 6 de octubre, la estrategia de trading que manejamos generó una señal clara que indicaba una alta probabilidad de un movimiento direccional a la baja (o venta/short).
A continuación, se detallan los indicadores y las condiciones específicas que convergieron para validar la alerta de este movimiento bajista:
1-VRVP. --ZONA GRIS
2-STOCH RSI--LINEA AZUL EN EXTREMOS
3-STOCH RSI--LINEA EN EXTREMOS Y CUCES LINEAS
4-ADX. --DEBILIDAD/FUERZA SEGUN EL CASO
5-VOLUMEN. --BAJO DE MOVIMIENTO ACTUAL.
6-MACD --MUESTRA HISTOGRAMA
Rsistrategy

Serie #3 MACD + Stoch RSI + AndeanThe Andean indicator is an advanced tool that helps you see what's happening beneath the surface of the price, measuring the momentum and energy of a trend.
However, like any non-standard indicator, it should be used with caution and always complemented with a broader technical analysis.
The combination of these tools will give you a complete and reliable view of the market. When you observe the change in direction of the indicators Stoch RSI (blue line), along with the volume of the MACD and the rise of the Andean indicator it shows whether the movement has strength, depending on the direction of the turn.
I recommend that you always combine it with other elements of your analysis, such as price action (candlestick patterns).
/////////////////////////////////////////////////////////////////////////////////////////////////////////
Andean(Verde o roja) + MACD(Verde y roja) + Stoch RSI (Linea azul)>
Indicador Andean es una herramienta avanzada que te ayuda a ver lo que sucede bajo la superficie del precio, midiendo el ímpetu y la energía de una tendencia. Sin embargo, como cualquier indicador no estándar, debe ser usado con precaución y siempre complementado con un análisis técnico más amplio.
La combinación de estas herramientas te dará una visión completa y fiable del mercado, cuando se observar el cambio de direcciòn de los indicadores: Stoch RSI (Linea azul), con el volumen del MACD y con el alza del indicador Andean muestra si el movimiento tiene fuerza o no, segun la direccion que realiza el giro.
Te recomiendo que siempre lo combines con otros elementos de tu análisis, como el análisis de la acción del precio (patrones de velas).
Importante
Tener las velas Heiken Ashi como complemento al analisis.