Esperando nuevos Minimos.despues de la fundamental al favor, solo veo que esa noticia vino acomodar el precio en un nivel clave donde puede irse en corto a buscar nuevos minimos!
Suerte Traders!
CAD

GBP/CAD (Análisis)Confirmaciones
Operar en compra
1) Esperar dos velas alcistas por encima de la zona.
2) Esperar el retest (Puede medirse con fibonacci)
Operar en venta
1) Esperar dos velas bajistas por debajo de la zona.
2) Esperar el retest (Puede medirse con fibonacci)


NZDCAD SELL!VENTA EN EL NZDCAD
CONFIRMACIONES:
FINAL DEL RETROCESO WXY DE DOBLE ESTRUCTURA EN CONFLUENCIA DE FIBONACCI Y EXTENSIÓN DE FIBONACCI
DIVERGENCIA EN MAC D Y RSI


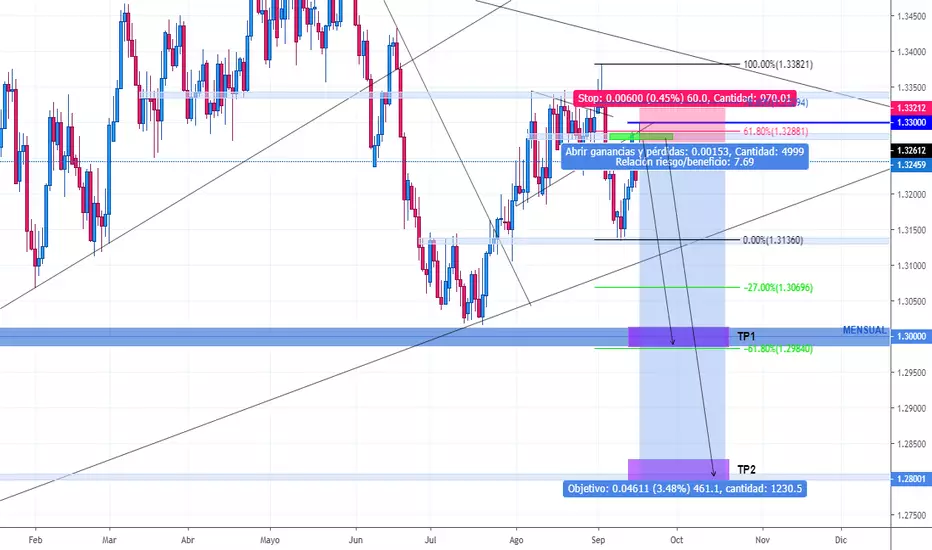
USD/CAD (Análisis) Análisis USD/CAD
Nos encontramos en un debilitamiento en el máximo reciente a TF 1H. Sin duda alguna llegamos a una zona temporal de oferta. A partir de eso, el precio presenta una tendencia bajista actual, con un promedio de 20 pips desde su retest inicial.
Recordemos que en te tipo de análisis es de vital importancia la confirmación del retest por la primer zona que respete.
De igual forma se puede apoyar con el fibonacci para confirmar un numero exacto durante el retest.
El numero del fibonacci que coincida exactamente con la zona.


GBPCAD; VentaPor muy poco pero es confirmado el doble suelo. Se podría presentar un cierto debilitamiento para las libras esta semana.

CADJPY ANALISIS D1Análisis en temporalidad D1 de posibles movimientos del par FX:CADJPY : Zona de entrada en venta, Doble Top, esperar confirmación de velas.
Estaré subiendo mis ideas constantemente cualquier comentario o recomendación sera bien recibida.
MAS ANÁLISIS EN MI PERFIL


USDCADUsdCad apoyo media de 200, Medias moviles de 8 y 18 a favor, a favor de la tendencia, retesteo el nivel 50 de fibonacci, convergencia en el rsi, formando tendencia alcista en timeframes menores

EUR/CAD (Análisis) Proyección EUR/CAD
Patrón formado a entorno "Bandera"
Conservar su fibonacci alcista en torno no rompa la cuota de 38%
Para postularse se forma alcista, esperar el quiebre por encima de la siguiente zona alcista (Realizar de igual un Retest)
Considerando tomar rápido un BE en torno a su siguiente zona importante en forma de resistencia.
Para postularse se forma bajista, esperar el quiebre por debajo de la zona. (Realizar de igual un Retest)

USDCADTriangulo descendente en meses, Reboto en fuerte resistencia en 4Hr, Tendencia bajista diaria, Tendencia bajista en 30Min

EURCAD POSIBLE COMPRASoporte semanal, Tendencia alcista semanal, triangulo ascendente en gráficos mensuales, Tendencia bajista en días, Doble piso en 4Hr, Tendencia bajista en días fue quebrada y retesteada en 4Hr, En Graficos de 1Hr-30Min muestra una tendencia alcista notable, Esperaria un engulfing alcista para confirmar entrada en 1Hr o 30Min para compra, Medias Moviles a Favor en 1Hr y 4Hr

USDCAD BUY Tendencia alcista en meses, Tendencia alcista en semanas, Múltiples soportes cerca del precio actual, Medias móviles a favor en 4Hr-1Hr-30Min y 15Min, Zona de consolidación en 1Hr, Rompió Zona de consolidación por arriba en 30Min, Tendencia alcista en 15Min

EURCAD BUYTendencia Alcista Semanal, Zona de Soporte Semanal, Doble Piso en 4Hr, Parte baja del canal bajista en 1Hr, Esta consolidando en 30Min, Divergencia en el RSI en 30Min, Cruce de Medias en 5Min, Cerca de cruzar en 15Min y 30 Min


USD/CAD CORTO H1/H4Rotura de soporte H4 y pullback del mismo, formación del patrón chartista Hombro Cabeza Hombro (HCH) muy probable la rotura del soporte marcado hasta la nueva zona de soporte

USD/CAD LARGO H1 / H4Toque y testeo de soporte ya probado anteriormente, es bastante probable que llegue hasta la siguiente resistencia
