SE desploma el mercado cripto, lo vemos...Muy buenas, inversores. Actualización corta del mercado.
El mercado cripto se encuentra bajo fuerte presión.
Bitcoin está tocando la zona de los 67K, una caída más profunda de lo que veníamos estudiando, especialmente luego de haber marcado los 80K como último LL dentro de la estructura.
Este movimiento implica algo clave:
👉 BTC pierde la estructura alcista semanal, oficiando esa zona como el soporte final de la tendencia que veníamos siguiendo.
A partir de ahora, el foco no está en adivinar pisos, sino en estudiar el retroceso y ver si el precio logra:
Confirmar reversión, o
Continuar con una fase correctiva más prolongada
Mirando el panorama macro, el análisis se traslada inevitablemente a cómo puede desarrollarse 2026, teniendo en cuenta que el año pasado Bitcoin cerró el anual con un -6%, algo que muchos subestiman pero que marca un antecedente importante.
La pregunta queda abierta:
👉 ¿Creen que 2026 puede ser un año aún más complejo para el mercado cripto?
👉 ¿O estamos frente a una limpieza necesaria antes de una nueva etapa?
Los leo 👀📉📊
Btc-e

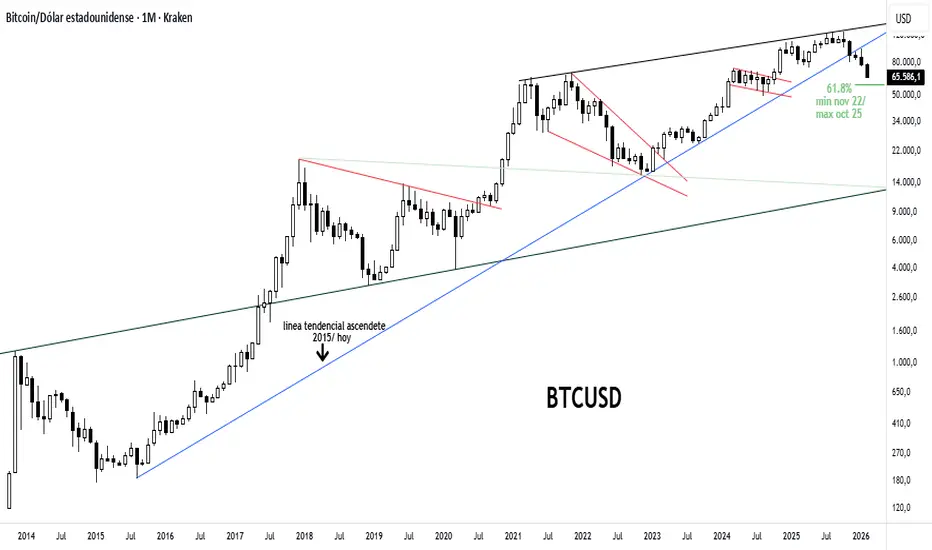
El BTCUSD continua con claro control por parte de los bearsEl soporte extremo apuntado hace tan solo una semana atrás para esta instancia ( ver informe adjunto ) me refiero a la zona entre 81000/84000 ptos ha sido penetrado y ello habilito un nuevo y hasta ahora incontrolable movimiento declinante, que siendo la 1.20pm horario NY lo encuentra prácticamente en el mínimo de toda la caída desde su máximo. Tal es así, que en esta oportunidad vuelvo sobre el chart de largo plazo, algo que no hacia hace ya un tiempo atrás, para mostrar de manera clara y contundente, toda la secuencia descendente, lo que en primer lugar fue impactar y respetar su resistencia de fondo y luego ir penetrando cada soporte apuntado desde entonces, destacándose fundamentalmente entre estos la linea tendencial ascendente originada en el año 2015 previo a cerrar el año 2025 y recientemente el 38.2% del ultimo movimiento ascendente entre el mínimo del año 2022 y su máximo histórico, lo cual ha significado continuar estrechando la distancia con el siguiente potencial soporte en esta nueva instancia, me refiero al 61.8% del citado movimiento alcista previo. Sin duda, los bears se han apoderado de la escena hace tiempo y aun no hay signos reales de reversión en puerta.
Rebote BTC! BTCUSDTHola amigos,
Después de algún tiempo vengo con otro análisis técnico.
Tengo 5 indicadores que nos pueden predecir de que el BTC ha llegado al fondo o que está muy cerca:
1. La media semanal de 200 periodos está en los 60k, es un soporte dinámico que puede representar un rebote o canalizar en dicha área.
2. Alto máximo de BTC de 2021, soporte situado entre los 65k y los 68k
3. Canal semanal, está dentro de la parte inferior, puede moverse cerca de los 60k, realizar una acumulación y moverse al alza.
4. Fibonacci del gran impulso realizado desde enero 2023 (3 años) genera métricas del 50% en el precio actual $70,500 por lo general, cuando el activo seguirá siendo alcista lo mas bajo que debería llegar es al 62% de retroceso en el impulso, situándolo en 58k.
5. Por último, pero no menos importante, si vemos el ciclo del precio utilizando el estocástico semanal con mi configuración, muestra una sobreventa bastante considerable, bajando del punto 20, cuando lo ha realizado en el pasado, o realiza un rebote considerable o canaliza algunas semanas en un precio cercano para seguidamente rebotar al alza.
Resumen:
Mi estimación es alcista, puede que tome algunas semanas para que se ejecute la acción, no creo que baje mucho al precio actual de 70.5k aunque mi escenario pesimista ronda los 60k. Obviamente nadie tiene la bola de cristal y esto no es una recomendación de compra, sino únicamente con fines de educación.

BTC a mitad de semana en 1DPara cortar la semana, un analisis de miercoles.
El BTC llegando al obtejivo de retroceso de fibnacci en el nivel 0,5 que son aproximadamente 70.000 usd. Buen nivel para empezar a llevar BTC haciendo DCA, peeeeeeeero, hemos de saber que si perfora el nivel 0,5 de fibo podemos ir a buscar soportes mas abajo aun, por ejemplo, otro nivel de soporte interesante son los 50.000 usd, y ya que estamos analizando, los 38.000 tampoco parecen muy lejanos.
Desde los indicadores, tenemos al MACD en niveles donde se podria dar un rebote.
Y desde el Koncorde, hemos llegado al mar.
Pocas veces hemos llegado tan abajo con estos indicadores, es de esperar que se produzca un pequeño rebote y luego veremos.
Por lo pronto, podemos afirmar que el objetivo bajista se alcanzo.
Si te gusto esta idea y las relacionadas, dale un impulso, me motiva a seguir escribiendo.

BTC: Proyección Macro - Divergencia SemanalESPAÑOL
Análisis de Ciclos y Halving: En este gráfico se observa un estudio detallado de los periodos post-halving. Históricamente, Bitcoin ha respetado una directriz principal de crecimiento. Sin embargo, tras el 4º Halving, el precio muestra señales de agotamiento al chocar con resistencias macro clave.
La Señal Crítica: Divergencia Bajista Semanal Como se aprecia en la temporalidad de 3D/Semanal, el precio ha marcado máximos crecientes mientras que el oscilador (MACD) muestra máximos decrecientes. Esta Divergencia Semanal es una señal de alerta temprana de un posible cambio de tendencia.
Escenario de Confirmación: El nivel crítico a vigilar son los $74,668 .
Confirmación: Una ruptura con volumen de este soporte activaría la estructura bajista.
Objetivo: Buscar el testeo de la directriz principal histórica.
Zonas de Proyección (Targets):
Zona 1: ~$48,256
Zona 2: ~$32,958
Zona 3: ~$25,181 (Directriz principal de largo plazo).
___________________________________________________
ENGLISH
Cycle and Halving Analysis: This chart shows a detailed study of post-halving periods. Historically, Bitcoin has followed a main growth trendline. However, after the 4th Halving, the price is showing signs of exhaustion as it hits key macro resistance levels.
Critical Signal: Weekly Bearish Divergence On the 3D/Weekly timeframe, the price has made higher highs while the oscillator (MACD) shows lower highs. This Weekly Divergence is an early warning signal of a potential trend reversal.
Confirmation Scenario: The critical level to watch is $74,668 .
Confirmation: A high-volume break below this support would trigger the bearish structure.
Objective: A retest of the main historical trendline.
Projection Zones (Targets):
Zone 1: ~$48,256
Zone 2: ~$32,958
Zone 3: ~$25,181 (Long-term main trendline).

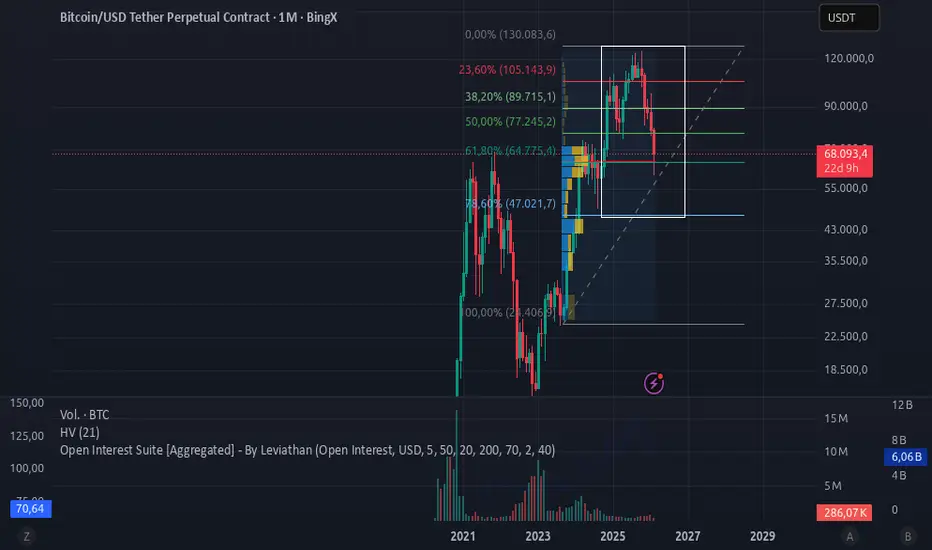
Bitcoin. En Monthly.El precio del Criptoactivo se encuentra, actualmente, cotizando en el rango de USD 68.000.
A sólo 6 días, de iniciado el mes de Febrero.
La vela mensual ha expresado, hasta el momento, una baja más que considerable (En relación a comportamientos mensuales anteriores).
Producto, de varios factores heterogéneos (Tales como la caída, a nivel global, de los Mercados, los últimos archivos revelados de Jeffrey Epstein. Y también un "Pump and Dump", que venía desarrollándose desde hace unos meses).
Los cuales derivaron, en esta homogeneidad. Expresada con la existente caída estrepitosa, del precio de la Criptomoneda.
Particularmente hoy, 06/02/26, la vela mensual se desenvuelve de forma ambivalente.
Propiciando incerteza, respecto de su contuidad (O no) a la baja.
En la jornada del día de ayer, logró cruzar a la baja al nivel de 61,8% de los Retrocesos de Fibonacci.
Así como también, al POC de Volumen.
Hoy presenta un leve retroceso en la acción de su precio.
Debido, quizás, al (Tan habitual) descenso en el volumen operatorio de los días Viernes.
Consecuentemente, continua el desenvolvimiento del Patrón M.
Iniciado ya, hace 18 ruedas mensuales.
El Volumen del Spot, manifiesta una disminución considerable.
Vislumbrando una clara convergencia, en relación al comportamiento actual de la vela de este mes.
La Volatilidad Histórica, se encuentra dentro de parámetros moderados.
Pero cercana a ingresar, en el umbral de variables altas.
En caso de conjugarse el incremento del Volumen operatorio y de la Volatilidad Histórica.
Así como también, de producirse los cruces definitivos al Nivel de 61,8% de los Retrocesos de Fibonacci y al POC de Volumen.
Entonces, en tal caso, la acción bajista (E indomable) del precio.
Probablemente, sea inevitable.
Datos relevantes, a la fecha:
- El precio de Bitcoin ha caído por debajo de USD 65.000. Esta caída representa uno de los peores rendimientos semanales desde finales de 2022.
- La prérdida significativa en su valor, contribuyó a una reducción enorme en la capitalización total del mercado cripto.
- Dicha caída, ha perjudicado gravemente a las tesorerías corporativas, de las mayores empresas tenedoras de Criptoactivos. Dejando pérdidas acumuladas, cercanas a decenas de miles de millones de dólares.
- El descenso acelerado de Bitcoin ha llevado a que casi USD 0.5 B, de valor del mercado Cripto, se pierdan en menos de una semana.
- El precio se ha acercado a sus niveles más bajos, desde que Donald Trump regresó a la presidencia.
Fuentes:
Reuters, Bloomberg, CriptoNoticias.
En virtud de lo expuesto, me tomé la libertad de seleccionar una base ATM, en relación con la operatoria de Opciones.
A fin de efectuar, los cálculos estadísticos y probabilísticos correspondientes.
Contrato seleccionado: BTC-260207-65000-P.
A tales efectos, y mediante la implementación de Modelos de Inteligencia Artificial, se obtuvieron los siguientes resultados.
Griegas:
Delta: 0.41.
Gamma: 0.43.
Vega: 0.45.
Theta: 0.40.
Rho: 0.37.
Probabilidad de Ocurrencia, de alcanzar el Strike de USD 65.000: 51.91%%.
Volatilidades:
Sigma h: 46.79%.
Sigma i: 43.99%.
Leverage: 0.40.
Regresión Lineal:
Coeficiente: -0.8174514174.
Correlación, entre Adj. Close y Volumen del Spot: Negativa.
Regresión Logística:
Return: 0.789471.
Correlación, entre Adj. Close y Volumen del Spot: Positiva.
Veremos, entonces.
Si continúa o no, este descenso tan pronunciado en el precio de la Criptodivisa.
Y la concresión final o no, del patrón M.
El tiempo, dirá.
El Mercado, también.
BTC, soporte roto, siguiente para en la zona de 50kMuestro el grafico en semanal, ya se que estamos a mediados de semana. La seriedad del caso amerita actualizaciones frecuentes.
Ayer, en la idea vimos que el BTC estaba llegando al objetivo, por lo que decidi hacer DCA y llevar BTC en 73.100, pero luego, a la noche, observe que rompio con fuerza a la baja, por lo que decidi cerrar con perdida del 3% en 70.800.... y menos mal, porque luego siguio bajando.
Por ahora la baja parece que continuara hasta la zona de los 50k, donde hay un soporte que antes fue resistencia 2 veces.
Esperemos se mantenga ahi, quizas si pueda hacerse DCA en ese valor.

INDICADORES TÉCNICOS (RESUMEN EJECUTIVO)RSI semanal: zona de sobreventa → condición de rebote posible
Media móvil 200 semanas: BTC se acerca a ella → históricamente zona de compra institucional
Volumen: aún no confirma acumulación fuerte → falta clímax de capitulación
👉 Lectura:
El mercado está barato relativamente, pero aún no ha dado señal de giro confirmada.
ESCENARIO A — CONTINÚA CORRECCIÓN (40%)
Pérdida clara de 60,000
Objetivo: 52k – 55k
Narrativa: pánico, liquidaciones finales
📌 Aquí compra el dinero inteligente, no el retail.
ESCENARIO B — LATERALIZACIÓN (35%)
BTC oscila entre 60k – 80k
Fase de acumulación silenciosa
Duración: semanas o meses
📌 Mercado aburrido = construcción de suelo.
ESCENARIO C — REBOTE ALCISTA (25%)
Recupera 80k con volumen
Objetivo inicial: 90k – 100k
Confirmación real solo > 103k
📌 No se anticipa, se confirma.
ESTRATEGIA 1 — INVERSOR DISCIPLINADO (SPOT, LARGO PLAZO)
Objetivo: acumular BTC con ventaja estadística.
📌 Entradas escalonadas
25% en 68k
35% en 60k
25% en 55k
15% reserva para evento extremo
⛔ Sin apalancamiento
⛔ Sin FOMO
⛔ Sin “todo de una”
ESTRATEGIA 2 — TRADER TÁCTICO (RIESGO CONTROLADO)
Entrada LONG
Confirmación: cierre diario > 80k
Stop: 75k
Target 1: 90k
Target 2: 103k
Entrada SHORT (solo si rompe)
Ruptura limpia < 60k
Target: 55k
Stop corto y técnico
⚠️ Solo para operadores con experiencia.
GESTIÓN DE RIESGO (NO NEGOCIABLE)
Riesgo por operación: máx. 1–2% del capital
BTC = activo volátil → posición dimensionada
Nunca operar sin:
stop
plan
escenario
❌ El mercado no castiga al que no sabe, castiga al que improvisa.
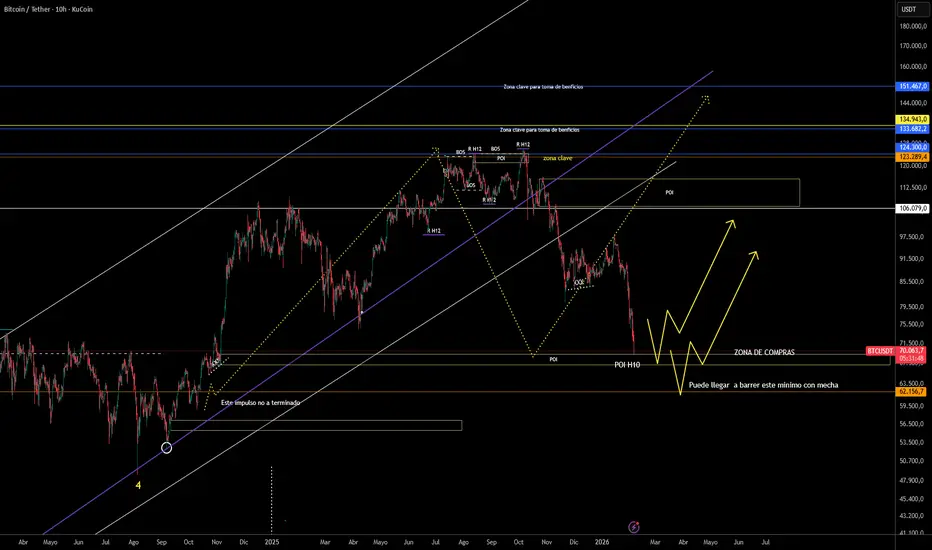
BTC en POI H10BTC se encuentra en el POI de H10, veremos si responde a este POI o va por el origen de lo que supongo es el movimiento correcto, y llega a la zona de 62, Pensando en BTC para mi es todo compra esta zona
EURUSD, Zona de demandas para posibles comprasConfirmaciones
1-Zona de demandas
2-Estructura alcista
3-Imbalance
4-Orderblock
5-Liquidez previa
6-FVG

BTC 1W.Temporalidad 1W – Divergencia oculta de ciclo (en construcción)
Se está formando una posible divergencia bajista oculta de tipo B, lo que sería una alerta temprana de agotamiento en el ciclo alcista actual.
📊 Conclusión:
La divergencia bajista semanal aún no está activa, pero su formación sería extremadamente significativa, ya que marcaría un techo macro (Q3–Q4) del ciclo alcista.
📉 Proyección 1W (si se activa):
Caída estructural hacia la EMA55W (hoy en ~$104K–$105K)
Riesgo mayor: si esa EMA se pierde con cuerpo de vela → se inicia ciclo bajista semanal
Confirmación W1: doble techo + RSI descendente + vela de rango amplio bajista

EURCHF, Zona de demandas para comprasConfirmaciones
1-Zona de demandas
2-Estructura alcista
3-Orderblock
4-Liquidez previa
5-FVG
6-Nivel de fibonacci

Btc movimiento importante, lo vemos..Buen inicio de semana, queridos inversores.
Como podemos observar, Bitcoin (BTC) finalmente realizó un movimiento relevante, el cual nos empieza a aportar información útil para el análisis del contexto actual.
Tal como veníamos siguiendo en posts anteriores, la zona de los 80.000 USD era una zona técnica clave. En los últimos días, BTC realizó el quiebre de ese nivel, llegando a marcar mínimos en torno a los 74.000 USD.
Por el momento, el precio se mantiene por encima de esa zona, y no se descarta un retroceso al alza, algo totalmente esperable desde el punto de vista estructural tras un movimiento impulsivo.
Ahora bien, no vamos a perder de vista el contexto macro:
BTC venía desarrollando una tendencia alcista de largo plazo, y el nivel de los 80k representaba su último soporte relevante dentro de esa estructura.
A partir de aquí, el mercado nos plantea dos escenarios principales:
📌 Trampa alcista, como pausa o corrección dentro de una tendencia mayor aún vigente.
📌 Confirmación de cambio de tendencia, si el retroceso no logra recuperar zonas clave y se valida debilidad estructural.
Durante la semana estaremos analizando el retroceso, las zonas de reacción y la lectura del precio para determinar si este movimiento es solo una corrección técnica o el inicio de una nueva fase del mercado.
🔍 Análisis exclusivo con el objetivo de aportar una visión clara, ordenada y coherente del mercado, siguiendo los 4 pilares fundamentales de Profit Trading.

EURUSD, Zona de demandas para comprasConfirmaciones
1-Zona de demandas
2-Estructura alcista
3-Imbalance
4-liquidez previa

BTC, en la zona que esperabamosEl BTC por fin llego a la zona donde esperábamos, en el grafico de 1S, llegando a entre los 70k y los 78k. Obsérvese que tiempo atrás esa zona fue resistencia y luego soporte.
Aun no entraremos, vamos a esperar que los indicadores nos marquen entrada en diario, ya que por ahora es un cuchillo en plena caída.
Por el lado del MACD, se observa divergencia bajista.
Por el lado de Koncorde, estamos llegado al mar, el paronama es aún peor si se observa el grafico en 1D.
Por otro lado, las dos últimas velas en diario muestran mechas, señal de que se está absorbiendo en ese precio cercano a los 77k.
Por el momento nos quedaremos expectantes, ha sido una baja importante, mañana con el mercado abierto algunos ETF seguramente salgan a llevar. Los precios son interesantes para comenzar a cargar para el largo plazo.
Recomiendo ver ideas relacionadas.

BTC/USDTel movimiento se dio claramente mas de 25 % si vendieron en 95 k
12 a 16 % si entraron en 91 k y como un 8 % si entraron en 87 k
realmente venimos vendiendo bitcoin desde los 116 k .. y idenfiticamos el movimiento temprano el comienzo del mercado bajista era obvio ..
ahora creo que bajaremos mas por que ahora el panico esta en el mercado pero la depresion y el desangre no a llegado ... tu mente dira ya bajo suficiente pero aprendimos que esto apenas empieza .. pude bajar siempre . no veo entrada clara en venta ya esta etapa como digo nada que hacer
tenemos una ruptura en graficos semanales pero esto ya es de largo plazo sigan mi analisis anteriores para ver un posible hch pero esta dificil que se cumpla .. pero esta caida fue bastante exitosa nos vemos pronto .. lastima lo de hyperliquid que subio mucho por fundameltaes y luego bajo pero bueno no todas se ganan

Bitcoin cerca del mejor punto de compra de hace 246 díasBuenas gente, si les gusta la DATA que les comparto, denle un BOOST al post, g r a c i a s :)
Análisis:
Mensual: RANGO BAJISTA COMPLETADO, queda un DOL mensual por cierre (de menor probabilidad) en los $80.500 aprox
SEMANAL CLAVE: de momento BAJISTA, estamos por debajo del mínimo de la semana previa y hoy sabado sigue por debajo... lo más probable es que se convierta en un DOL BAJISTA SEMANAL para la semana que viene...
Diario: ALCISTA, rango diario confirmado, por ende objetivos alcistas... el primero muy por seguro que se va a tomar, probablemente el LUNES, nuevo MES... importantísimo
El plan sería NO SUMARSE a estas compras por que hay muchos objetivos bajistas aún...No soy scalper y solo opero los mejores setups.
Esperar que DIARIO se alinee bajista para vender en corto hasta el monthly dol... y COMPRAR luego de limpiarlo mientras tenga una alineación semanal/diaria o simplemente sin que sea contraria.

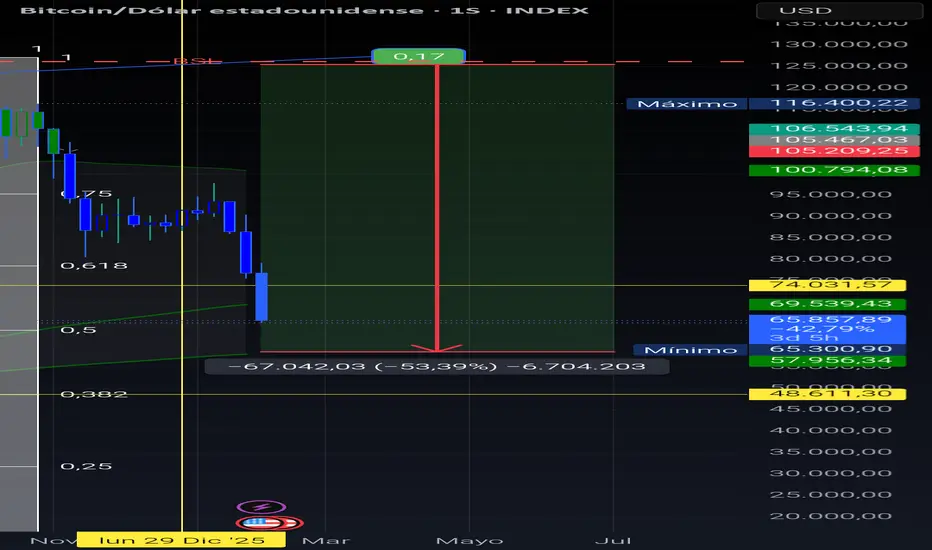
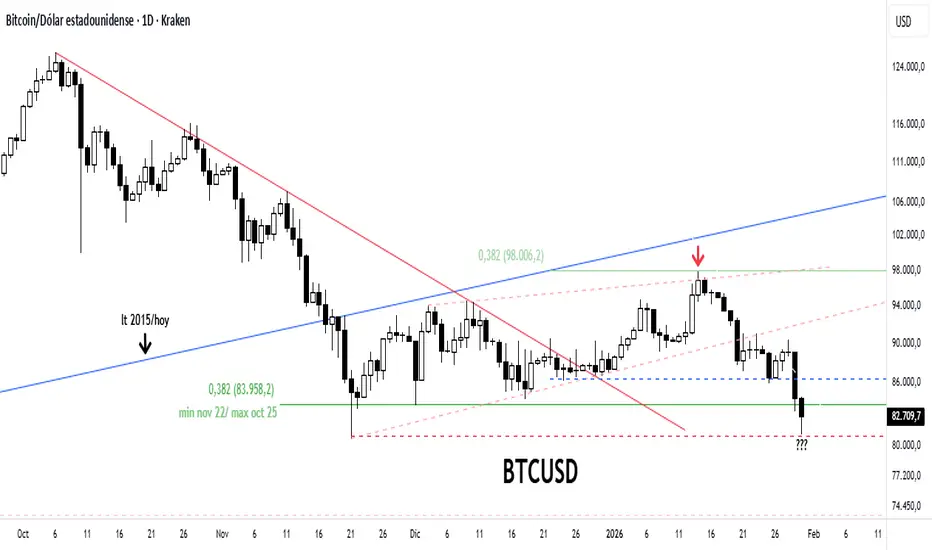
El BTC en zona de soporte extremoEl soporte intermedio apuntado tan solo unos días atrás ( ver informe adjunto ) no aguanto el embate declinante originado como te señalara también en aquel research tras impactar de lleno en el 38.2% de recorte de todo el movimiento declinante previo y por lo tanto ha ido en busqueda de su soporte extremo en esta instancia, representado por aquel mínimo registrado en Noviembre del año 2025 y por el 38.2% de recorte todo el movimiento ascendente entre el mínimo de Nov /22 y el máximo de Oct/25, expresados en términos base cierre semanal. Allí, al menos de momento, han aparecido compradores y ha reaccionado un tanto su precio, pero sin duda es la zona a cuidar/ mantener viva por parte de los bulls, si pretenden revertir la situación extrema en la cual se encuentran.
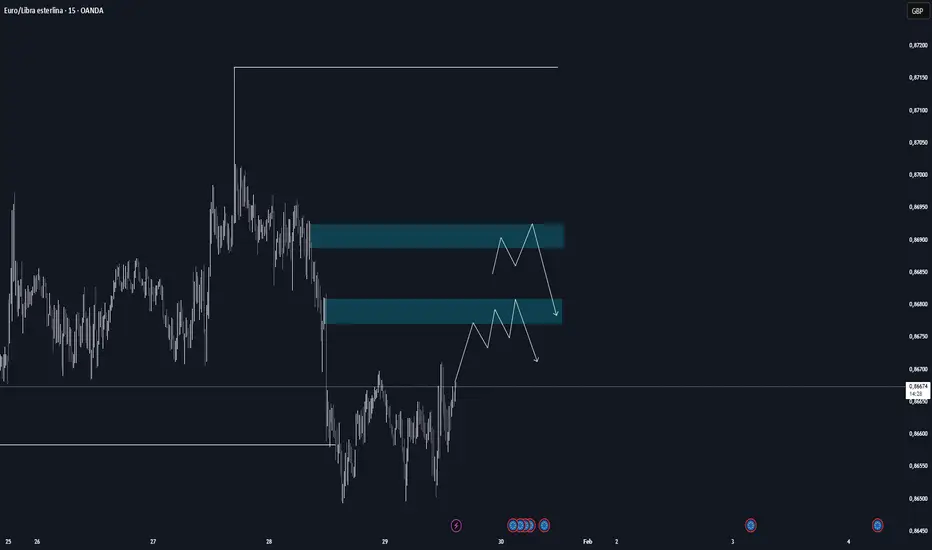
EURGBP, Zona de ofertas para ventasConfirmaciones
1-Zona de ofertas
2-Imbalance
3-Orderblock
4-Liquidez previa
¿Fin del Rally? Por qué espero a Bitcoin en $73,500Hola a todos,
Les comparto mi proyección a largo plazo para Bitcoin. Actualmente, mi sesgo es bajista buscando una corrección saludable.
📉 El Escenario: Espero que el precio retroceda hasta la zona de los $73,500. Esta es mi zona clave para evaluar si retomamos la fuerza compradora.
⚠️ Zona de Peligro: En caso de que el soporte de los $73,500 no se respete, la estructura podría debilitarse y llevarnos a visitar niveles mucho más bajos, con un objetivo potencial en los $35,500.
📺 En el video adjunto explico el "porqué" técnico detrás de estos niveles. ¡Espero que les aporte valor!
Tu turno: ¿Crees que los $73k aguantarán o nos vamos al infierno? Déjame en los comentarios tu opinión y ¿qué otro par te gustaría que analice la próxima vez?
Si te gustó el análisis, no olvides darle a "Boost" 🚀

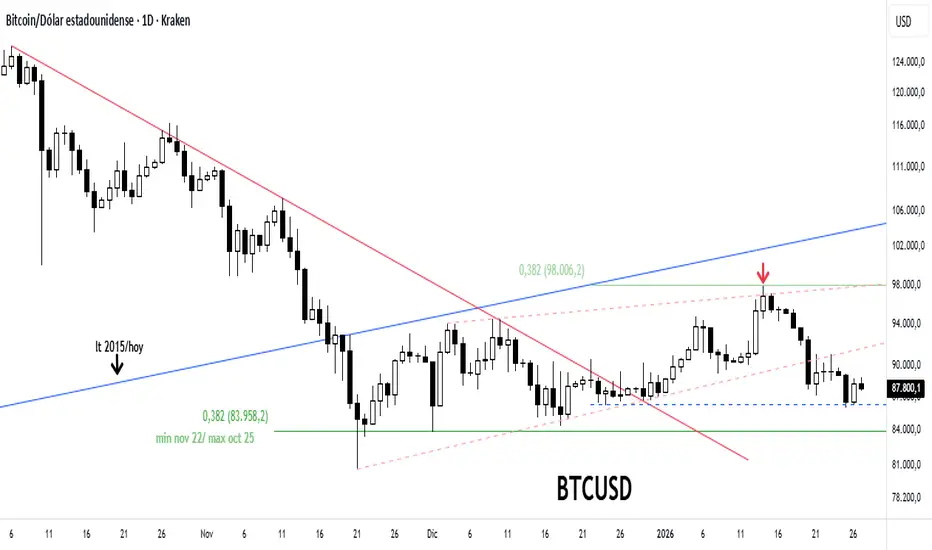
El BTC choco contra la resistencia y continua bajo presionLa 1era resistencia apuntada en el ultimo reporte ( ver informe adjunto ) que guardaba relacion directa con el 38.2% de recorte de todo el movimiento declinante previo resulto ser un murallón para la reacción señalada desde zona de soporte extremo y desde allí la principal cripto moneda entro en franca caída, lo cual incluyo penetrar la linea inferior de la cuña que se detalla en la grafica alcanzado el 1er soporte a considerar en esta instancia y que guarda relacion con los mínimos que se vieran entre finales de Diciembre y la pasada semana. Solo de ser esta linea finalmente penetrada, no antes, el foco se trasladaría al soporte extremo en esta instancia, expresado en términos base cierre semanal, el 38.2% de recorte entre el mínimo de Nov /22 y el máximo de Oct/25.
EURJPY, Zona de ofertas para ventasConfirmaciones
1-Zona de ofertas
2-Estructura bajista
3-Liquidez previa
4-Imbalance
5-Nivel de fibonacci

EURUSD, Zona de demandas para seguir subiendoConfirmaciones
1-Zona de demandas
2-Estructura alcista
3-Imbalance
4-Orderblock
5-Liquidez previa
