The Pitchfork Precision: ZM’s Multi-Tool Reversal Signal
## The Seller's Validation (Points 1→3)
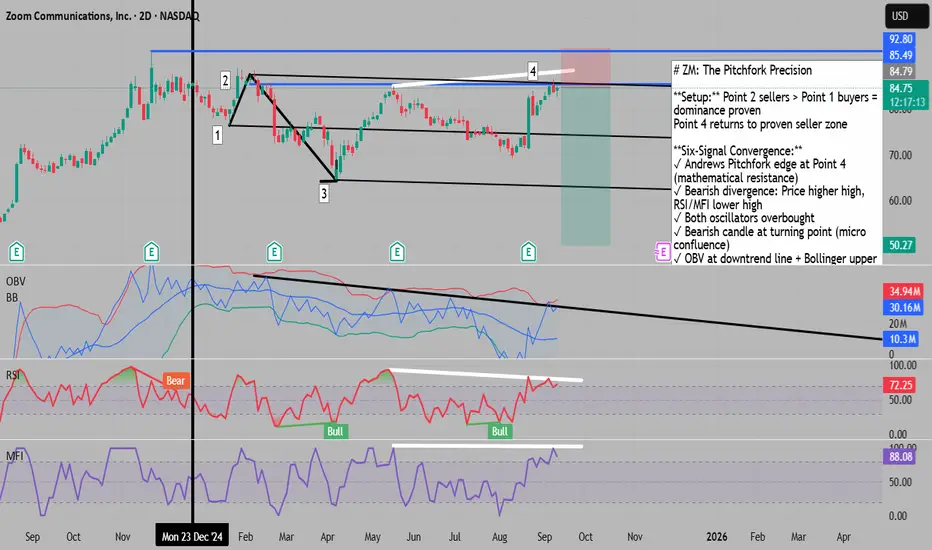
The power dynamic shifted decisively when Point 2 sellers crushed through Point 1 buyers, driving price to a new low at Point 3. This wasn’t a minor victory – it was proof of seller supremacy in the local structure. Now at Point 4, price has returned to these proven sellers’ domain, setting the stage for potential rejection.
## Andrews Pitchfork: The Mathematical Edge
Applying Andrews Pitchfork to Points 1, 2, and 3 reveals something remarkable: Point 4 sits precisely at the upper median line (edge). This isn’t coincidence – it’s mathematical precision. According to pitchfork theory, price at the edge faces two probable paths:
- Return to the median line (bearish)
- Push to the opposing outer median line (extremely bearish)
Both scenarios favor the downside, making this a high-probability short setup.
## The Six-Signal Convergence
1. Momentum Divergence
- Price: Higher high at Point 4
- RSI/MFI: Lower highs = Classic bearish divergence
This disconnect between price and momentum reveals waning buyer strength.
2. Oscillator Extremes
- RSI: Overbought territory
- MFI: Overbought territory
Both momentum indicators scream overextension.
3. Micro Confluence
The bearish candle at Point 4 provides immediate confirmation – a micro-level signal validating the macro setup.
4. OBV Double Resistance
- OBV Downtrend Line: Acting as dynamic resistance
- OBV Bollinger Band Upper: Additional resistance layer
When volume indicators align with price resistance, the signal strengthens exponentially.
5. VWAP 2nd Deviation Touch
Point 4 precisely tags the 2nd standard deviation of VWAP (anchored from Point 1). This represents a 95% statistical extreme – price rarely sustains above this level.
6. Structural Resistance
Return to proven seller territory established at Point 2.
## The Probability Stack
What makes this setup exceptional isn’t any single indicator – it’s the convergence of six independent signals:
- Structure says sellers dominate
- Pitchfork says we're at mathematical resistance
- Momentum says buyers are exhausted
- Volume says selling pressure building
- Statistics say we’re at an extreme
- Price action confirms with bearish candle
When this many unrelated indicators align, probability shifts dramatically in favor of the trade.
## The OBV Tell
The OBV downtrend line deserves special attention. While price has been attempting recovery, volume has been declining – a classic bear market signature. The fact that OBV also sits at its Bollinger Band upper resistance creates a volume ceiling that price will struggle to overcome.
## Execution Framework
Entry: Bearish confirmation at Point 4
Stop: Above Point 2 (seller validation level)
Target 1: Pitchfork median line
Target 2: Pitchfork lower median line
Target 3: Point 3 support / opposing outer median
Risk Management: The confluence of signals allows for tight stops while targeting multiple profit zones based on pitchfork projections.
## Market Context
ZM’s post-pandemic normalization continues to play out technically. The repeated failures at resistance levels, combined with declining volume patterns, suggest institutional distribution rather than accumulation. This technical setup aligns with the fundamental narrative of reduced video conferencing dependency.
---
Key Insight: When Andrews Pitchfork, VWAP deviation, momentum divergence, volume analysis, and price structure all point the same direction, you’re not gambling - you’re executing a high-probability, mathematically-backed trade setup.
for trading mentorship and community, message me on telegram : jacesabr_real
Exención de responsabilidad
La información y las publicaciones que ofrecemos, no implican ni constituyen un asesoramiento financiero, ni de inversión, trading o cualquier otro tipo de consejo o recomendación emitida o respaldada por TradingView. Puede obtener información adicional en las Condiciones de uso.