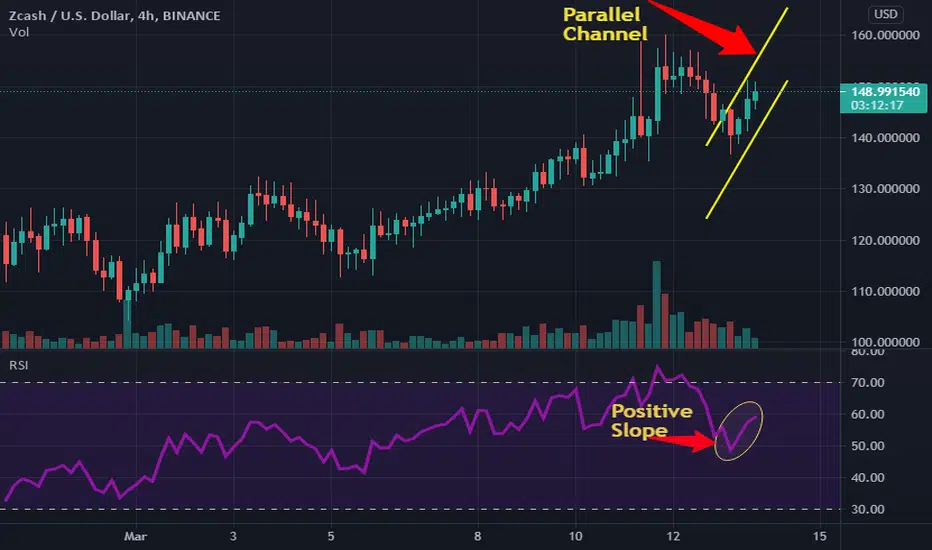
.The daily chart of ZEC hints at the start of a bullish move. On coming to the shorter time frame of 4 hours, the coin has formed a upward parallel channel. If the price breaks above 5% of the current position, it can see a rally upto $200 in upcoming trading sessions.ZEC price can also see a new low if it comes below the channel.
Kindly comment your thoughts below
Kindly comment your thoughts below
Publicaciones relacionadas
Exención de responsabilidad
La información y las publicaciones que ofrecemos, no implican ni constituyen un asesoramiento financiero, ni de inversión, trading o cualquier otro tipo de consejo o recomendación emitida o respaldada por TradingView. Puede obtener información adicional en las Condiciones de uso.