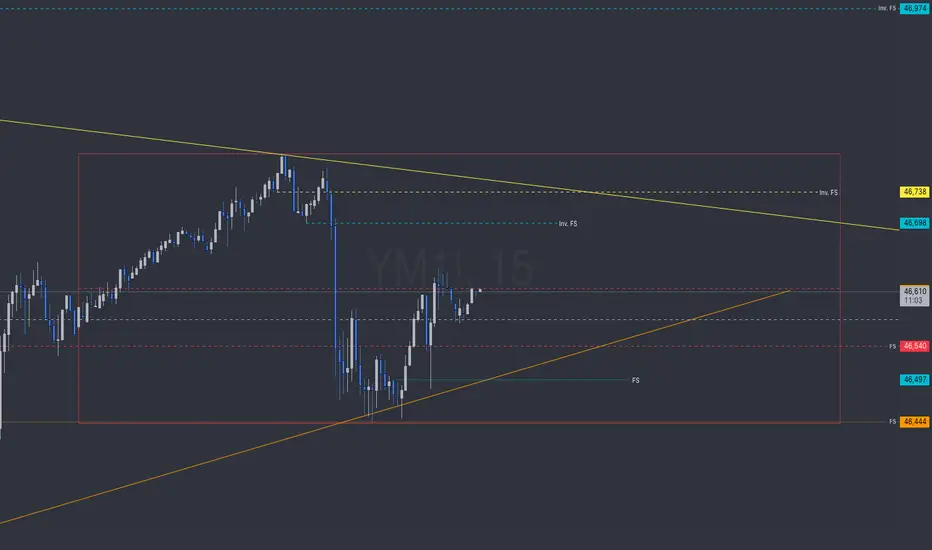
Levels are marked on the screen and color coded to the timeframe they were created on.
Weekly box is grey and shows the high, low and median range.
The red box is a daily high, low and median from yesterday.
Orange levels are 4hr timeframe
yellow is the hourly timeframe and blue is the 15min timeframe.
Weekly box is grey and shows the high, low and median range.
The red box is a daily high, low and median from yesterday.
Orange levels are 4hr timeframe
yellow is the hourly timeframe and blue is the 15min timeframe.
Exención de responsabilidad
La información y las publicaciones que ofrecemos, no implican ni constituyen un asesoramiento financiero, ni de inversión, trading o cualquier otro tipo de consejo o recomendación emitida o respaldada por TradingView. Puede obtener información adicional en las Condiciones de uso.
