September 5th Gold Trend Analysis and Trading Strategy:
Key Focus: US Non-Farm Payroll Data
I. Core Fundamental Analysis
Bullish Factors:
Federal Reserve Rate Cut Expectations: Market expectations of the Fed starting rate cuts at its mid-month meeting are the core driver of gold's consecutive record highs. The prospect of an accommodative monetary policy reduces the opportunity cost of holding gold, providing fundamental support for gold prices.
Geopolitical Risk: Ongoing geopolitical tensions have enhanced gold's appeal as a traditional safe-haven asset.
Bearish/Risk Factors:
Technical Profit-Taking: After gold prices reached a record high for seven consecutive days, they accumulated significant short-term profit-taking. Thursday's (September 4th) pullback of over 1% suggests that bulls are partially closing their positions and locking in profits, which is the primary pressure for the price correction.
Bond Market Sell-off: Global bond markets experienced a sell-off, sending interest rates (yields) soaring. This typically signals market concerns about inflation or the economic outlook, potentially attracting some funds from non-interest-bearing gold to interest-bearing assets. This diverges from gold's upward trend and presents a significant risk signal.
Non-farm Payroll Data Preview: Today's release of the US August non-farm payroll data is the biggest variable of the day. The data's performance will directly impact expectations of a Fed rate cut:
Strong data → Cooling rate cut expectations → Bullish for the US dollar, bearish for gold.
Weak data → increased expectations of rate cuts → bad for the dollar, good for gold.
II. Key Technical Analysis
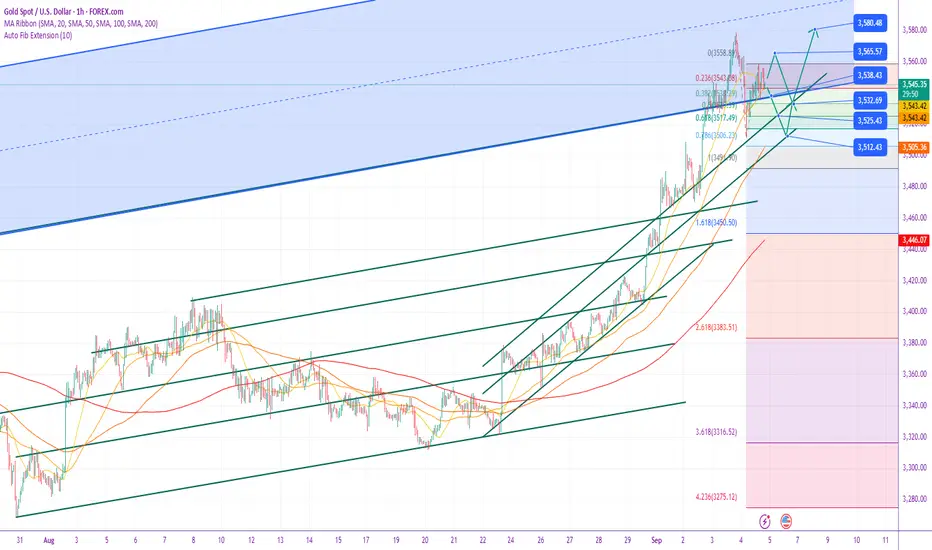
Current Trend: The long-term uptrend remains intact, but a short-term correction from the highs is indicated. The daily line closed with a long upper shadow, indicating heavy selling pressure from above.
Key Resistance Levels:
Primary Resistance: $3555-3560/oz (hourly resistance, yesterday's US rebound high, today's bull-bear watershed)
Strong Resistance: $3570-3580/oz (historical high)
Key Support Levels:
Initial Support: $3530-3520/oz (4-hour mid-line congestion zone, yesterday's Asia-Europe consolidation platform)
Important Support: $3510-3508/oz (Thursday's correction low, strong support from the 5-day moving average on the daily chart and a psychological barrier)
Ultimate Support: $3490-3480/oz (deep correction target)
III. Comprehensive Trading Strategy
Core Principle: Exercise caution and trade within a range before data releases; follow the trend after data releases. 1. Pre-Data Strategy (Before the Non-Farm Payrolls Data Release): Range-Bound Trading
Sell on Rebounds: If gold prices rebound to the $3555-3565 area and show signs of stagflation (such as a bearish close with a long upper shadow on the hourly chart), try a small short position with a stop-loss above $3570, targeting $3540-3530.
Buy on Pullbacks: If gold prices pull back to the $3520-3530 support area and show signs of stabilization (such as a hammer candlestick or bullish engulfing candlestick), try a small long position with a stop-loss below $3515, targeting $3545-3555.
2. Post-Data Strategy (After the Non-Farm Payrolls Data Release): Trade on Breakouts
Breakout Scenario: If weak data leads to a strong breakout and consolidation of gold prices above $3560, follow up with a long position, targeting $3570-3580. Breakout Scenario: If strong data causes gold prices to effectively break below the $3,510 support level, short positions can be followed, targeting the $3,500-3,490 area.
3. Conservative Strategy:
Primarily wait and see, waiting for the release of the non-farm payroll data to clarify the market direction before entering the market. Avoid the risk of sharp fluctuations and spread widening immediately after the data release.
IV. Risk Warning and Position Management
Major Risk Event: All operations today must prioritize the non-farm payroll data. The data results are unpredictable and could trigger sharp market fluctuations.
Strict Stop-Loss: Regardless of the strategy chosen, a stop-loss must be set to prevent significant losses due to data trends that go against expectations.
Light position operation: Before the data, all transactions should be kept light, and sufficient funds should be reserved to cope with the trend market after the data.
Summary: Gold's medium- to long-term bullish logic remains unchanged, but it faces short-term technical correction pressure. The key to successful trading today lies in its response to the non-farm payroll data. It is recommended to buy low and sell high with a range-bound approach in the Asian and European sessions, and enter and exit quickly.
Operación activa
Spot Gold (XAUUSD) Day Trading Strategy:
Key Insight:
Gold prices are expected to fluctuate before the release of the non-farm payroll data. The overall trend is bullish, but caution should be taken against the risk of a sudden market crash after a bullish rally. Trading strategies will primarily focus on long positions at key support levels, supplemented by short positions at key resistance levels. Focus on the market's reaction to the highs following the release of the non-farm payroll data.
Key Price Levels:
Core Support: 3535-3530 -> 3525 -> 3508 (Yesterday's low and moving average combined support)
Core Resistance: 3560-3564 (Yesterday's US high and early morning breakout) -> 3578-3582 (previous high and 4-hour upper limit) -> 3600-3605
Specific Intraday Trading Strategy
Trading in the Asian and European Sessions (before the Non-Farm Payrolls) during the Range:
[Short Sell at Highs]
Entry Area: 3560-3565
Defensive Level: 3570 (above yesterday's high)
Target: 3545-3540 -> 3535-3530
Logic: Betting on a volatile pullback below the key resistance area before the data.
[Buy Lows]
Entry Area: 3530-3533 (Joint support of the daily MA5 and the 4-hour middle line)
Defensive Level: Below 3525
Target: 3545-3555
Logic: Buy on dips within the core support area, consistent with the daily bullish trend, and with a good profit-loss ratio.
Possible Scenarios and Strategies After the Non-Farm Payroll Data:
Scenario 1: Prices rise after the data, reaching new highs
Strategy: Look for secondary shorting opportunities in the 3575-3585 area, betting on a significant correction after the positive data has run its course or a "buy the anticipation, sell the reality" pattern.
Defensive Level: Above 3590 or 3605
Target: Expect a $50-100 decline (i.e., target 3525-3508, or even lower).
Scenario 2: Price drops immediately after the data release, holding onto core support.
Strategy: If the price falls back to key support areas such as 3525 or 3508 and stabilizes, it could be considered an opportunity to re-enter the trend-buying market.
Defensive level: Set below the support level based on the specific entry point.
Target level: Targets are expected to rise again to the 3550-3560 area.
Market Analysis Summary
Daily Chart: Technical indicators (MACD golden cross, STO overbought) indicate the overall trend remains bullish, with key support near the MA5 moving average at 3533.
4-Hour Chart: MACD dead cross, STO corrects upward, indicating a high-level range. The Bollinger Bands are narrowing and the range is compressing. 3570-3582 is a strong resistance area above, while 3532 is key support below.
1-hour level: Moving averages are entangled, Bollinger Bands are extremely narrowed, and the oscillation pattern is clear. Waiting for data to guide the direction.
Risk Warning:
Non-farm payroll data is highly uncertain and may lead to significant market fluctuations. All strategies should be operated with minimal positions and strict stop-loss orders. Market liquidity may deteriorate and spreads may widen around the release of data, so be mindful of transaction costs and slippage risks.
Operación cerrada: objetivo alcanzado
Will gold prices continue to rise on September 8th?
I. Fundamental Analysis
The release of the US non-farm payroll data for August, released on Friday (September 5th), caused a significant market turmoil and provided strong fundamental momentum for gold's rise.
The data was extremely weak: only 22,000 new non-farm payrolls were added, far below the expected 75,000. More notably, the June data was significantly revised downward to -13,000, indicating that the labor market's weakness is not a fluke but rather a trend of stalling. At the same time, the unemployment rate rose to 4.3%, the highest level since 2021, further confirming that the momentum of the US economy is slowing down.
Expectations of a Fed rate cut have sharply increased: Such weak data has significantly strengthened market bets on a Fed rate cut. Currently, the market generally believes a September rate cut is a foregone conclusion, with the probability of a 25 basis point cut approaching 100%, and even discussions of a 50 basis point cut are emerging. This strong expectation of easing is the core driver of gold prices.
Potential Risks and Uncertainties: While the prospect of a rate cut is positive, investors should remain vigilant to potential uncertainties. Inflationary pressures have not yet been fully overcome. If the CPI data released next week unexpectedly rises, it could constrain the Fed's easing efforts. Furthermore, the outlook for the US election and related tariff rhetoric could create new inflationary uncertainties, limiting gold's short-term upside potential.
Fundamental Conclusion: The non-farm payroll data has solidified strong market expectations for a rate cut, creating an overall environment that is extremely bullish for gold. Any weak or dovish economic data would boost gold prices, while an unexpected rebound in inflation could trigger short-term volatility.
II. Technical Analysis
Trend Positioning: Gold is currently in a strong, unilateral upward trend, with the overall technical structure intact and targeting all-time highs.
Key Support (Long-Term Support):
The 5-day moving average has now moved up to the 3545-3550 area. This is the first key support level maintaining the extremely strong short-term trend. As long as gold prices close above this moving average, the upward trend will remain intact. Even if there is a false move to break down this position during the trading session (to lure a short), there is no need to panic as long as the price can be recovered in the end.
4-Hour Bollinger Band Middle Line: Currently moving up to around 3555. This level is the watershed between short-term bullish and bearish strength. If the middle line holds, prices will maintain a relatively strong upward trend. A break below it could trigger a deeper correction, but this will provide a better opportunity to "get on board" for further gains.
Key Resistance:
The upper short-term target resistance level is 3600-3610, a key area to overcome in the near term. A break above will open up further upside potential.
Technical Conclusion: The technical pattern resonates with the fundamentals, indicating a clear bullish trend. Operationally, the key strategy should be to follow the trend, focusing on looking for opportunities to buy at low levels.
III. Trading Strategy for Next Week
Key Strategy: Focus on buying on dips to lows, and be cautious about rallies to higher levels.
Long Strategy (Main Strategy):
Ideal Long Range: 3560-3570. If gold prices pull back into this range and show signs of stabilization (such as a pin bar or bullish engulfing candlestick on the 4-hour chart), this could be considered a good dip-buying opportunity.
Aggressive long position: around 3555 (4-hour middle candlestick). As long as this support holds, it can be considered an entry point during a strong rally.
Stop-loss: Recommended stop-loss: Below key support, around 3540.
Targets: First target: 3600; second target: 3610 or above.
Short strategy (secondary strategy):
Only when gold prices first rebound to the strong resistance zone of 3600-3610 and show clear signs of resistance (such as a long upper shadow or bearish engulfing candlestick), consider a short-term short position with a small position, entering and exiting quickly to capitalize on a technical pullback.
Remember: Shorting against the trend is risky, so strictly control your position size and stop-loss (place the stop-loss above 3615). The core strategy remains to go long with the trend.
Risk Warning: Pay close attention to next week's US CPI data, as its results could trigger a market repricing of the extent of the Fed's interest rate cuts, causing significant gold price fluctuations. Investors are advised to manage their positions prudently and exercise effective risk control.
❤️Free gold trading signals:t.me/+7W6lfjoqQ-Y2NjU0
🥇Gold price trend analysis and forecast
💹Technical analysis (K-line patterns, trend lines, indicator systems)
✅Gold's safe-haven properties and asset allocation strategy
🥇Gold price trend analysis and forecast
💹Technical analysis (K-line patterns, trend lines, indicator systems)
✅Gold's safe-haven properties and asset allocation strategy
Publicaciones relacionadas
Exención de responsabilidad
La información y las publicaciones que ofrecemos, no implican ni constituyen un asesoramiento financiero, ni de inversión, trading o cualquier otro tipo de consejo o recomendación emitida o respaldada por TradingView. Puede obtener información adicional en las Condiciones de uso.