PROACHING LIQUIDITY ZONE – WAITING FOR CPI TO DECIDE NEXT MOVE
📌 MARKET RECAP
Gold kicked off the week with a sharp $50 drop, breaking through key trendlines and nearby support zones.
The selling pressure came from:
Profit-taking after the recent strong rally.
USD strength expectations ahead of CPI data (forecast ~0.1% better than the previous reading).
Geopolitical factor: Ukraine–Russia ceasefire talks moving towards a conclusion, fueling risk-off sentiment.
🧐 WHAT’S NEXT?
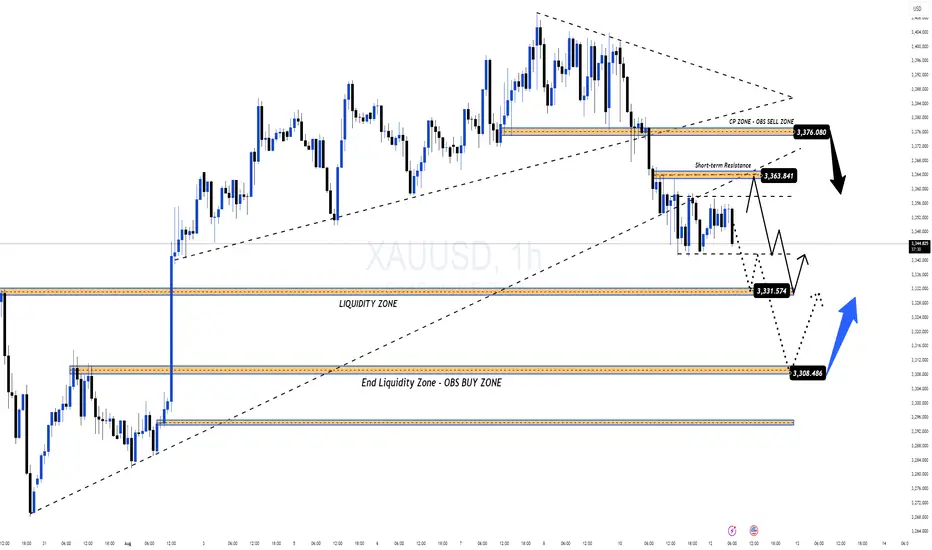
If CPI beats expectations → USD strengthens → Gold could drop further into the Liquidity Zone 333x – 330x.
If CPI disappoints → USD weakens → Gold may quickly bounce back toward key level 337x (previous breakdown zone) for a retest before deciding direction.
🎯 MMFLOW GAME PLAN
1️⃣ BUY SCALP
📌 Entry: 3331 – 3329
📌 SL: 3325
📌 TP: 3335 – 3340 – 3345 – 3350 – 3360 – 3370 – 3380
2️⃣ BUY ZONE
📌 Entry: 3310 – 3308
📌 SL: 3304
📌 TP: 3314 – 3318 – 3322 – 3326 – 3330 – 3335 – 3340 – 3350 – 3360 – ???
3️⃣ SELL SCALP
📌 Entry: 3363 – 3365
📌 SL: 3370
📌 TP: 3360 – 3356 – 3352 – 3348 – 3344 – 3340
4️⃣ SELL ZONE
📌 Entry: 3376 – 3378
📌 SL: 3382
📌 TP: 3372 – 3368 – 3364 – 3360 – 3355 – 3350 – 3340
⚠️ RISK NOTE
CPI is the market’s dice roll – even a small deviation could trigger massive stop hunts.
Always watch the KeyLevels marked on the chart before entering trades.
Gold kicked off the week with a sharp $50 drop, breaking through key trendlines and nearby support zones.
The selling pressure came from:
Profit-taking after the recent strong rally.
USD strength expectations ahead of CPI data (forecast ~0.1% better than the previous reading).
Geopolitical factor: Ukraine–Russia ceasefire talks moving towards a conclusion, fueling risk-off sentiment.
🧐 WHAT’S NEXT?
If CPI beats expectations → USD strengthens → Gold could drop further into the Liquidity Zone 333x – 330x.
If CPI disappoints → USD weakens → Gold may quickly bounce back toward key level 337x (previous breakdown zone) for a retest before deciding direction.
🎯 MMFLOW GAME PLAN
1️⃣ BUY SCALP
📌 Entry: 3331 – 3329
📌 SL: 3325
📌 TP: 3335 – 3340 – 3345 – 3350 – 3360 – 3370 – 3380
2️⃣ BUY ZONE
📌 Entry: 3310 – 3308
📌 SL: 3304
📌 TP: 3314 – 3318 – 3322 – 3326 – 3330 – 3335 – 3340 – 3350 – 3360 – ???
3️⃣ SELL SCALP
📌 Entry: 3363 – 3365
📌 SL: 3370
📌 TP: 3360 – 3356 – 3352 – 3348 – 3344 – 3340
4️⃣ SELL ZONE
📌 Entry: 3376 – 3378
📌 SL: 3382
📌 TP: 3372 – 3368 – 3364 – 3360 – 3355 – 3350 – 3340
⚠️ RISK NOTE
CPI is the market’s dice roll – even a small deviation could trigger massive stop hunts.
Always watch the KeyLevels marked on the chart before entering trades.
Operación activa
🏆 PERFECT BUY SCALP – HIT TP +80 PIPS AT LIQUIDITY ZONE!📌 Trade Result:
Our Buy Scalp plan at 3331 – 3329 smashed TP with +80 PIPS right at a clean liquidity zone, delivering a BIG WIN for MMF traders!
📊 Post-CPI Action:
Price followed AD’s forecast exactly.
Data came out almost as expected, with only one slightly weaker reading – not significant.
Gold spiked up before dumping hard – exactly like the original plan.
🔍 Now:
Price is testing a key level – watch closely to see if it holds. If it breaks, look for setups at lower key levels.
📍 Chart:
Operación cerrada: objetivo alcanzado
📌 Trade Recap:Our daily BUY SCALP plan hit an impressive +260 PIPS at the identified key liquidity level – exactly as anticipated in the analysis.
This level proved to be crucial for the bulls, holding price firmly and fueling the rally.
📊 Why It Worked:
Key liquidity zone perfectly aligned with MMF technical framework.
Strong buyer defense kept price above the support line.
Momentum kicked in right on schedule with the plan.
🔍 What’s Next:
Continue tracking key levels for potential re-entries if price retests this zone or shows fresh breakout signs.
📍 Chart:
⚜️Trade with Money Market Flow, logic, Price action
🔥Live Market Updates-Realtime Trading Plans & Signal
t.me/+vpD6XCC9jP05ZDQ1
⚜️Risk Reward 1.3 to 2.5...
⚜️Daily 8 to 16 Signals VIP
MMFLOW gives you precision entries & BIGWIN profits
🔥Live Market Updates-Realtime Trading Plans & Signal
t.me/+vpD6XCC9jP05ZDQ1
⚜️Risk Reward 1.3 to 2.5...
⚜️Daily 8 to 16 Signals VIP
MMFLOW gives you precision entries & BIGWIN profits
Publicaciones relacionadas
Exención de responsabilidad
The information and publications are not meant to be, and do not constitute, financial, investment, trading, or other types of advice or recommendations supplied or endorsed by TradingView. Read more in the Terms of Use.