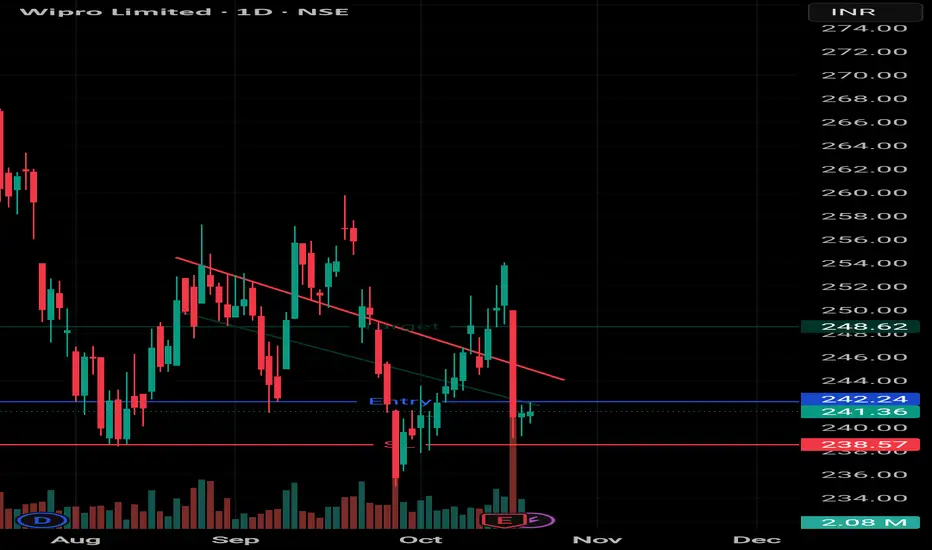
The latest price chart highlights a Falling Wedge pattern, a classic bullish formation that often signals the downtrend is losing strength and a breakout to the upside could be near. The stock has been consolidating within the wedge, and a breakout above the resistance line could confirm a strong upward move.
Exención de responsabilidad
La información y las publicaciones no constituyen, ni deben considerarse como asesoramiento o recomendaciones financieras, de inversión, de trading o de otro tipo proporcionadas o respaldadas por TradingView. Más información en Condiciones de uso.
Exención de responsabilidad
La información y las publicaciones no constituyen, ni deben considerarse como asesoramiento o recomendaciones financieras, de inversión, de trading o de otro tipo proporcionadas o respaldadas por TradingView. Más información en Condiciones de uso.