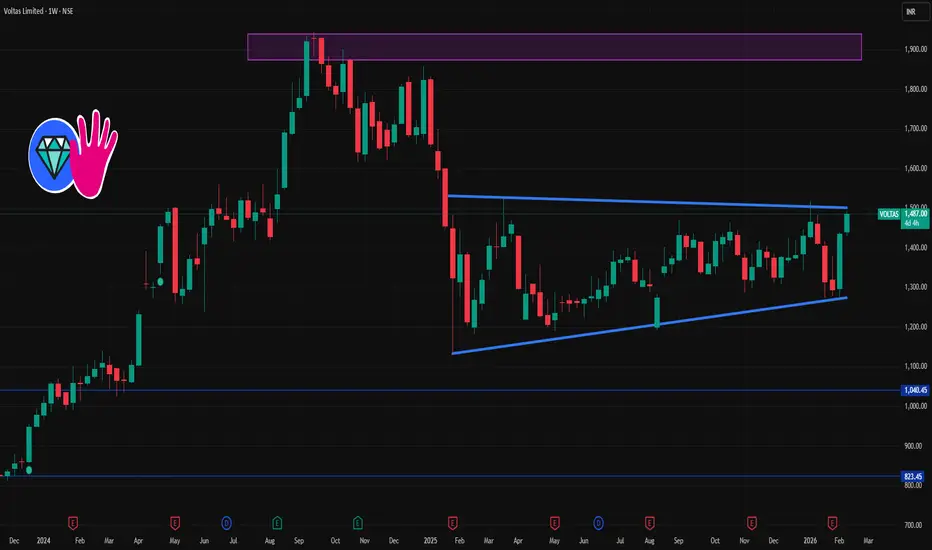
💹 Current price range (approx): ₹1,430–₹1,485 (varies across platforms).
📊 Key Levels for Next Week
🔼 Upside / Resistance Levels
These are levels where price might face supply/selling pressure this week:
₹1,480–₹1,500 — near recent peaks and psychological zone
₹1,500–₹1,520 — secondary resistance (historical / pivot region)
🔽 Downside / Support Levels
Important zones where buyers might step in if price dips:
₹1,380–₹1,395 — near short-term support from pivots
₹1,350–₹1,370 — broader support zone where price has bounced recently
₹1,320–₹1,330 — deeper support if weakness continues
📌 Pivot Reference
Some pivot calculations for weekly help gauge trend direction:
Weekly Pivot ~₹1,381
R1 ~₹1,492 / R2 ~₹1,550 / S1 ~₹1,354 / S2 ~₹1,312 (depends on calculation method)
📉 What Technical Indicators Suggest
Short-term price action has shown strength in momentum indicators on intraday and daily (e.g., strong buy signals).
Some weekly indicators show mixed signals (momentum present but not overly strong).
Analyst screens show a variety of bias — some strong buy on short term, others neutral/weak on weekly.
🧠 Quick Strategy Notes (for traders)
Bullish break above ₹1,500 could open room toward ~₹1,520–₹1,550+ (short-term).
Sustained break below ₹1,380 may signal deeper pullback toward ~₹1,350–₹1,320.
Keep an eye on volume and candlestick signals around these key zones.
Publicaciones relacionadas
Exención de responsabilidad
La información y las publicaciones no constituyen, ni deben considerarse como asesoramiento o recomendaciones financieras, de inversión, de trading o de otro tipo proporcionadas o respaldadas por TradingView. Más información en Condiciones de uso.