Technical Analysis & Breakout Potential –  VNET
VNET
1. Technical indicators show a "Strong Buy"
According to TipRanks, VNET scores strongly across several technical indicators such as RSI, MACD, and multiple moving averages—all signals point toward buy recommendations Investing.com also concludes with a “Strong Buy” sentiment across short, medium, and long term
2. Positive fundamental trigger: high revenue growth while maintaining guidance
VNET grew revenue by 22.1% year-over-year, and EBITDA rose 27.7%—while EPS disappointed. However, 2025 full-year guidance remains solid at 9.15 to 9.35 billion yuan, showing confidence in operational strength .
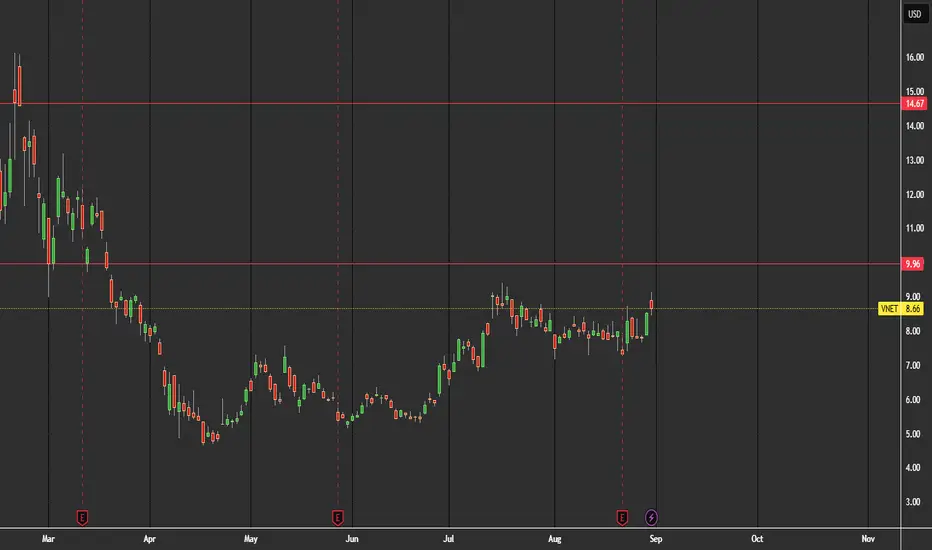
3. Technical price action and resistance zone
Today’s intraday high is around $9.25—just below $9.35. Barchart identifies resistance levels at R2: $8.98 and R3: $9.42 The stock is clearly approaching this breakout zone and confirms technical strength across higher moving averages such as MA20, MA50, MA100, and MA200
4. Volatility & outlook
VNET shows above-average volatility (~12% weekly) compared to the tech sector (~8.4%). For momentum strategies, however, this can drive rapid upside—especially during a technical breakout.
Verdict & Recommendation
Breakout level: $9.35 – a strong resistance level. A close above this would be a clear bullish trigger.
Upside potential: Breakout toward $9.42 – and possibly further toward $11+ based on analyst targets (avg. $11.20 → ~+29%)
Strong momentum: Supported by technical indicators and revenue growth; a solid risk/reward case.
Caution: High volatility means sharp moves in both directions — stop-loss management is essential.
1. Technical indicators show a "Strong Buy"
According to TipRanks, VNET scores strongly across several technical indicators such as RSI, MACD, and multiple moving averages—all signals point toward buy recommendations Investing.com also concludes with a “Strong Buy” sentiment across short, medium, and long term
2. Positive fundamental trigger: high revenue growth while maintaining guidance
VNET grew revenue by 22.1% year-over-year, and EBITDA rose 27.7%—while EPS disappointed. However, 2025 full-year guidance remains solid at 9.15 to 9.35 billion yuan, showing confidence in operational strength .
3. Technical price action and resistance zone
Today’s intraday high is around $9.25—just below $9.35. Barchart identifies resistance levels at R2: $8.98 and R3: $9.42 The stock is clearly approaching this breakout zone and confirms technical strength across higher moving averages such as MA20, MA50, MA100, and MA200
4. Volatility & outlook
VNET shows above-average volatility (~12% weekly) compared to the tech sector (~8.4%). For momentum strategies, however, this can drive rapid upside—especially during a technical breakout.
Verdict & Recommendation
Breakout level: $9.35 – a strong resistance level. A close above this would be a clear bullish trigger.
Upside potential: Breakout toward $9.42 – and possibly further toward $11+ based on analyst targets (avg. $11.20 → ~+29%)
Strong momentum: Supported by technical indicators and revenue growth; a solid risk/reward case.
Caution: High volatility means sharp moves in both directions — stop-loss management is essential.
Exención de responsabilidad
La información y las publicaciones no constituyen, ni deben considerarse como asesoramiento o recomendaciones financieras, de inversión, de trading o de otro tipo proporcionadas o respaldadas por TradingView. Más información en Condiciones de uso.
Exención de responsabilidad
La información y las publicaciones no constituyen, ni deben considerarse como asesoramiento o recomendaciones financieras, de inversión, de trading o de otro tipo proporcionadas o respaldadas por TradingView. Más información en Condiciones de uso.