🔎 Chart Overview
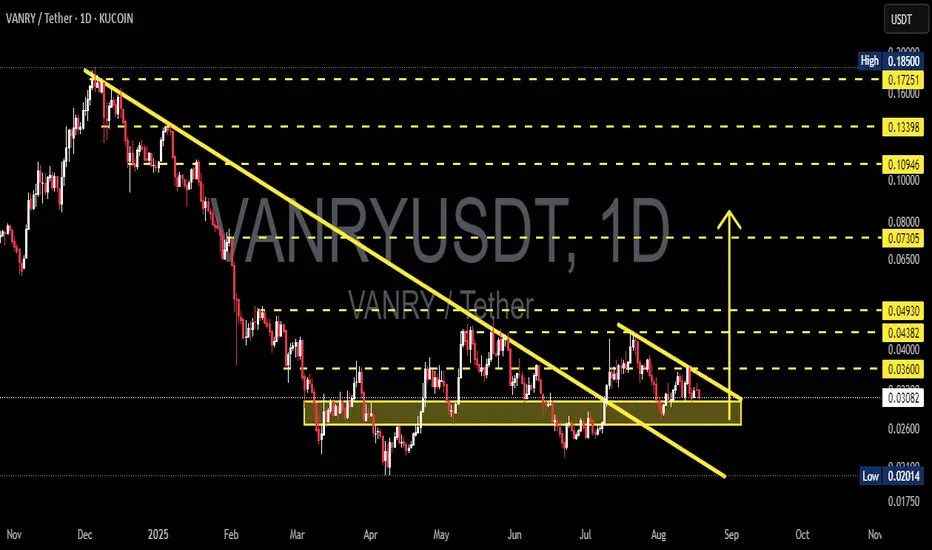
VANRY/USDT is currently in a consolidation phase after a prolonged downtrend since early 2025. Key observations:
Price is stuck inside the demand zone 0.028 – 0.036 USDT (yellow box), which has acted as strong support for months.
A symmetrical triangle pattern is forming, indicating accumulation before a decisive move.
The descending trendline is still pressing the price down, but the apex is approaching → a major breakout or breakdown is imminent.
---
🚀 Bullish Scenario
Trigger:
✅ Daily close above 0.036 USDT with strong volume → breakout from the triangle and descending trendline.
Potential targets:
🎯 First target: 0.040 – 0.04382 USDT (minor resistance + triangle height projection).
🎯 Next target: 0.04930 USDT (key resistance).
🎯 With strong momentum: extension toward 0.07305 USDT, and potentially 0.109 – 0.133 USDT in the mid-term.
Additional bullish confirmation:
Successful retest of 0.036 as new support after breakout.
Increased buying volume confirming buyer dominance.
---
🐻 Bearish Scenario
Trigger:
❌ Daily close below 0.030 – 0.028 USDT → breakdown of the demand zone and triangle.
Potential targets:
🎯 First target: 0.026 USDT.
🎯 Next target: 0.024 USDT (triangle breakdown projection).
🎯 If selling pressure intensifies, price may revisit the historical low at 0.02014 USDT.
Additional bearish confirmation:
Breakdown supported by high volume.
Weak or no rebound after falling below 0.028.
---
📌 Conclusion
VANRY is at a critical stage. The symmetrical triangle within the demand zone signals price compression that will soon resolve.
A breakout above 0.036 USDT could spark a strong rally.
A breakdown below 0.028 USDT could open the way toward 0.02014 USDT.
👉 Key levels to watch: 0.036 (bullish breakout) and 0.028 (bearish breakdown) with daily close and volume confirmation.
#VANRY #VANRYUSDT #CryptoAnalysis #PriceAction #SymmetricalTriangle #Breakout #CryptoTrading #AltcoinAnalysis #TechnicalAnalysis
✅ Get Free Signals! Join Our Telegram Channel Here: t.me/TheCryptoNuclear
✅ Twitter: twitter.com/crypto_nuclear
✅ Join Bybit : partner.bybit.com/b/nuclearvip
✅ Benefits : Lifetime Trading Fee Discount -50%
✅ Twitter: twitter.com/crypto_nuclear
✅ Join Bybit : partner.bybit.com/b/nuclearvip
✅ Benefits : Lifetime Trading Fee Discount -50%
Exención de responsabilidad
La información y las publicaciones que ofrecemos, no implican ni constituyen un asesoramiento financiero, ni de inversión, trading o cualquier otro tipo de consejo o recomendación emitida o respaldada por TradingView. Puede obtener información adicional en las Condiciones de uso.