USD/CHF Short: The Avalanche Has Begun - Trading in the Footstep
📈 USDCHF | SHORT | Swing Trade
Good day, traders,
Today, I'm sharing an in-depth analysis of USD/CHF, where we are seeing an A+ short setup developing. All timeframes are in perfect alignment, and the institutional order flow is telling a very clear story of extreme weakness. The core of this trade is identifying large clusters of "Buyers Underwater"—traders who are trapped in losing positions and will act as a wall of resistance.
Let's break this down step-by-step, from macro to micro.
1. The Macro View (Daily Chart)
On the daily chart, we see an undeniable, sustained downtrend. The price has recently broken through a key support zone. Our order flow indicator shows a massive cluster of trapped buyers (marked in gold/yellow) around the 0.81000 - 0.82000 zone. These are long-term positions that are now heavily underwater. This area will act as a massive wall of selling pressure on any serious attempt at a rally, as these parties will look to exit their positions with minimal loss.
Conclusion (1D): The path of least resistance is down.
2. The Strategic View (4H Chart)
The 4-hour chart confirms and accelerates the bearish sentiment. What we see here is a textbook picture of a one-sided market:
Lower Highs & Lower Lows: The trend structure is perfectly bearish.
Layered Resistance: Every minor rally in the past has been immediately and aggressively sold off. This has created layers of trapped buyers at multiple levels above the current price. This is the 'fuel' for the next move down.
Conclusion (4H): Sellers are in complete control. Rallies are opportunities to sell.
3. The Tactical View (1H / 15M Charts)
Zooming into the lower timeframes, we can see the immediate weakness. The recent drop was nearly vertical, indicating a 'selling climax'. The current small bounce is very weak and lacks conviction. The order flow shows this bounce is running directly into the first wall of trapped buyers. This is our chance to get in for the next leg down.
The Concrete Trade Plan
This is a "Failed Rally Short" setup. We are waiting for the weak bounce to reach a logical resistance level, and then we enter.
➡️ SETUP: Short
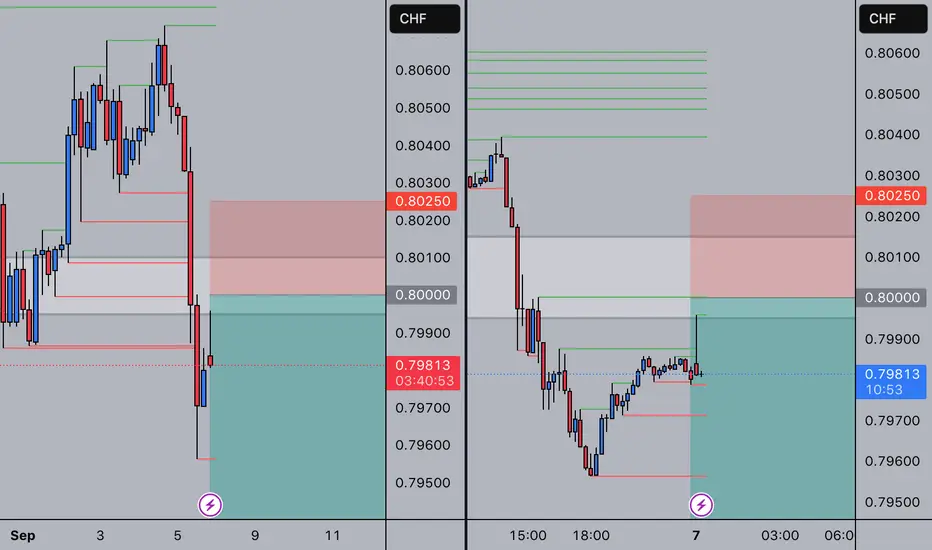
🎯 ENTRY ZONE: 0.79950 - 0.80100
🔍 CONFIRMATION: In this zone, I want to see buying pressure dry up. Look for bearish price action on the 15M/5M (e.g., pin bars, engulfing candles, liquidity grab) as confirmation that sellers are taking back control.
⛔ STOP LOSS: 0.80250
Reason: A tight stop just above the next cluster of trapped buyers. A break above this level invalidates the immediate bearish pressure.
💰 TAKE PROFIT 1: 0.79700 (Recent Low)
Action: Take partial profits, move stop loss to break-even.
💰 TAKE PROFIT 2: 0.79500 (Psychological level & next liquidity zone)
Action: Let the remainder of the position run, as the higher timeframes show little support below.
Disclaimer: This is my personal analysis and trade plan, not financial advice. The markets can be unpredictable. Always conduct your own research and apply proper risk management. Trade responsibly.
Good luck!
#USDCHF #Short #OrderFlow #PriceAction #TechnicalAnalysis #Forex #TradingIdea #TrappedTraders
Good day, traders,
Today, I'm sharing an in-depth analysis of USD/CHF, where we are seeing an A+ short setup developing. All timeframes are in perfect alignment, and the institutional order flow is telling a very clear story of extreme weakness. The core of this trade is identifying large clusters of "Buyers Underwater"—traders who are trapped in losing positions and will act as a wall of resistance.
Let's break this down step-by-step, from macro to micro.
1. The Macro View (Daily Chart)
On the daily chart, we see an undeniable, sustained downtrend. The price has recently broken through a key support zone. Our order flow indicator shows a massive cluster of trapped buyers (marked in gold/yellow) around the 0.81000 - 0.82000 zone. These are long-term positions that are now heavily underwater. This area will act as a massive wall of selling pressure on any serious attempt at a rally, as these parties will look to exit their positions with minimal loss.
Conclusion (1D): The path of least resistance is down.
2. The Strategic View (4H Chart)
The 4-hour chart confirms and accelerates the bearish sentiment. What we see here is a textbook picture of a one-sided market:
Lower Highs & Lower Lows: The trend structure is perfectly bearish.
Layered Resistance: Every minor rally in the past has been immediately and aggressively sold off. This has created layers of trapped buyers at multiple levels above the current price. This is the 'fuel' for the next move down.
Conclusion (4H): Sellers are in complete control. Rallies are opportunities to sell.
3. The Tactical View (1H / 15M Charts)
Zooming into the lower timeframes, we can see the immediate weakness. The recent drop was nearly vertical, indicating a 'selling climax'. The current small bounce is very weak and lacks conviction. The order flow shows this bounce is running directly into the first wall of trapped buyers. This is our chance to get in for the next leg down.
The Concrete Trade Plan
This is a "Failed Rally Short" setup. We are waiting for the weak bounce to reach a logical resistance level, and then we enter.
➡️ SETUP: Short
🎯 ENTRY ZONE: 0.79950 - 0.80100
🔍 CONFIRMATION: In this zone, I want to see buying pressure dry up. Look for bearish price action on the 15M/5M (e.g., pin bars, engulfing candles, liquidity grab) as confirmation that sellers are taking back control.
⛔ STOP LOSS: 0.80250
Reason: A tight stop just above the next cluster of trapped buyers. A break above this level invalidates the immediate bearish pressure.
💰 TAKE PROFIT 1: 0.79700 (Recent Low)
Action: Take partial profits, move stop loss to break-even.
💰 TAKE PROFIT 2: 0.79500 (Psychological level & next liquidity zone)
Action: Let the remainder of the position run, as the higher timeframes show little support below.
Disclaimer: This is my personal analysis and trade plan, not financial advice. The markets can be unpredictable. Always conduct your own research and apply proper risk management. Trade responsibly.
Good luck!
#USDCHF #Short #OrderFlow #PriceAction #TechnicalAnalysis #Forex #TradingIdea #TrappedTraders
Nota
Look for 15min liquidity grab around 0.8000Operación cerrada: objetivo alcanzado
Exención de responsabilidad
La información y las publicaciones que ofrecemos, no implican ni constituyen un asesoramiento financiero, ni de inversión, trading o cualquier otro tipo de consejo o recomendación emitida o respaldada por TradingView. Puede obtener información adicional en las Condiciones de uso.