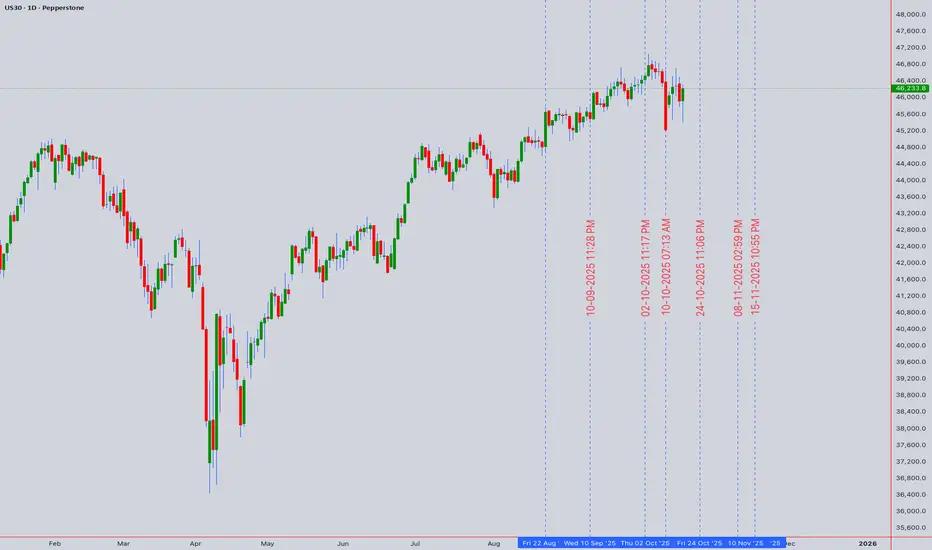
The US30 consolidates near a significant technical inflection point at 46,233.8. Our multi-timeframe analysis reveals a battle between bullish structure and emerging bearish divergences.
📊 Multi-Timeframe Synthesis & Market Structure
Daily (Trend Bias): The primary trend remains bullish above the key support confluence of 45,800 (50 EMA & Rising Trendline). However, price is testing the lower boundary of a bullish channel. A break below 45,800 would signal a deeper correction towards 45,200.
4H & 1H (Swing Setup): The index is forming a potential Bearish Rising Wedge. RSI on the 4H chart shows a clear bearish divergence, indicating weakening momentum. This is a cautionary sign for swing bulls.
Intraday (15M/5M - Precision): Price is trapped between immediate resistance at 46,450 and support at 46,100. The 5M chart shows Anchored VWAP (from yesterday's low) acting as dynamic resistance. A break below 46,100 targets 45,950.
🧠 Key Technical Narratives & Theories
Elliott Wave & Wyckoff: The pullback from the recent high exhibits characteristics of a Wave 4 correction or a Wyckoffian re-distribution phase. Volume analysis on breakdowns will be key.
Gann Angle & Square of 9: Critical Gann support resides near 45,950-46,000. A decisive break below this zone opens the path for a move towards the next Gann square level near 45,500.
Ichimoku Cloud: On the 4H, price is hovering above the Kumo (cloud). The Tenkan-Sen (red line) is flat, indicating short-term equilibrium. A break below the cloud would be a strong bearish trigger.
⚖️ Momentum & Volume Assessment
RSI (14): Reading of 52 on the 1D, neutral but leaning bearish on lower timeframes with divergences.
Bollinger Bands (20): Price is pressing the middle band (20 SMA). A sustained break below it often signals a shift to a short-term bearish phase.
Anchored VWAP & Volume: Recent up-moves have occurred on declining volume, suggesting a lack of strong bullish conviction—a potential bull trap formation.
🛠️ Trade Plan & Levels
Swing Short Idea: Consider shorts on a break & close below 46,100 (15M), targeting 45,800 and 45,500. Stop loss above 46,550.
Intraday Long Idea: Only above 46,450 (with volume), targeting 46,700. Stop loss below 46,300.
Intraday Short Idea: On a rejection from 46,450 or break of 46,100, targeting 45,950.
💡 The Bottom Line
The US30 is at a critical decision point. The bullish trend is under threat until price reclaims 46,700. The weight of evidence from divergences and pattern formation favors a bearish breakdown in the short term. Risk is elevated; position size accordingly.
Disclaimer: This is technical analysis, not financial advice. Trade at your own risk.
I am nothing @shunya.trade
Exención de responsabilidad
La información y las publicaciones no constituyen, ni deben considerarse como asesoramiento o recomendaciones financieras, de inversión, de trading o de otro tipo proporcionadas o respaldadas por TradingView. Más información en Condiciones de uso.