US30 | Countertrend Setup From Long-Term Fibonacci Target Zone
The Market Flow | Oct 27, 2025
Technical Overview
Weekly / Daily:
• Price has reached the 138.2% Fibonacci extension, aligning with the upper boundary of the long-term impulse zone.
• This region represents a potential profit-taking area within an extended expansion phase.
• The daily structure completed an impulse to the 161.8% Fibonacci target.
• Market currently trades inside a high-probability reaction zone, suggesting risk of corrective flow.
H4:
• Price action shows initial hesitation beneath the prior breakout.
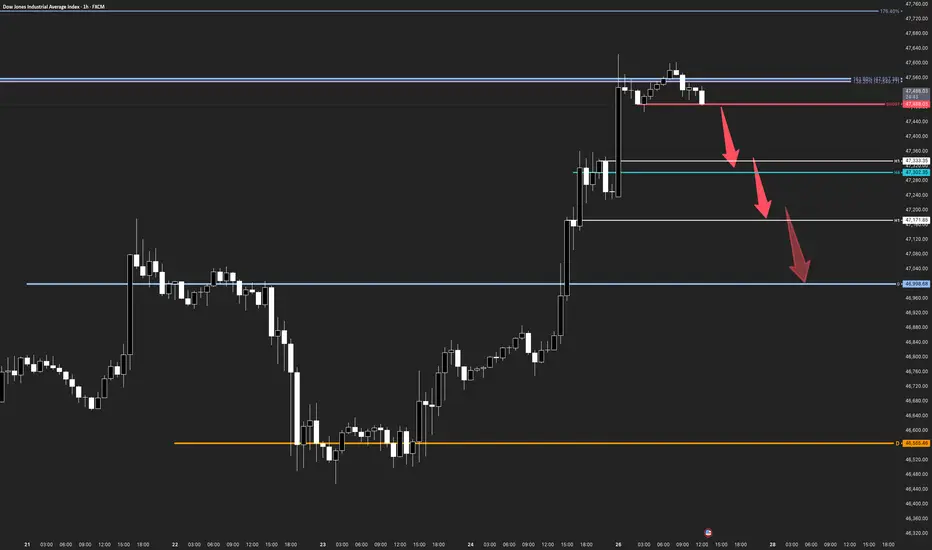
• Intermediate structural support rests near 47,330–47,200, representing the first countertrend target.
H1:
• A defined trigger = 47,488 (red SHORT level) marks potential short confirmation if broken with a 1–2–3 sequence on M15.
• Below this level, the path → 47,333 → 47,171 → 46,998 aligns with visible breakout retests.
Trade Structure & Levels
• Bias: Bearish countertrend short below 47,488
• Trigger = 47,488
• Invalidation = 47,580 (H1 structure high)
• Path → 47,333 → 47,171 → 46,998
• Phase: Countertrend within extended impulse reaching long-term target zone
Risk & Event Context
• Long-term momentum remains bullish, but exhaustion signals at key Fibonacci confluence may induce a corrective phase.
• Watch for volatility spikes near macro releases or equity session opens that could accelerate profit-taking.
Conclusion
US30 sits within its long-term Fibonacci target zone. A confirmed lower-timeframe trigger below 47,488 would validate a short-term countertrend move toward daily breakout levels before broader structure reassessment.
Technical Overview
Weekly / Daily:
• Price has reached the 138.2% Fibonacci extension, aligning with the upper boundary of the long-term impulse zone.
• This region represents a potential profit-taking area within an extended expansion phase.
• The daily structure completed an impulse to the 161.8% Fibonacci target.
• Market currently trades inside a high-probability reaction zone, suggesting risk of corrective flow.
H4:
• Price action shows initial hesitation beneath the prior breakout.
• Intermediate structural support rests near 47,330–47,200, representing the first countertrend target.
H1:
• A defined trigger = 47,488 (red SHORT level) marks potential short confirmation if broken with a 1–2–3 sequence on M15.
• Below this level, the path → 47,333 → 47,171 → 46,998 aligns with visible breakout retests.
Trade Structure & Levels
• Bias: Bearish countertrend short below 47,488
• Trigger = 47,488
• Invalidation = 47,580 (H1 structure high)
• Path → 47,333 → 47,171 → 46,998
• Phase: Countertrend within extended impulse reaching long-term target zone
Risk & Event Context
• Long-term momentum remains bullish, but exhaustion signals at key Fibonacci confluence may induce a corrective phase.
• Watch for volatility spikes near macro releases or equity session opens that could accelerate profit-taking.
Conclusion
US30 sits within its long-term Fibonacci target zone. A confirmed lower-timeframe trigger below 47,488 would validate a short-term countertrend move toward daily breakout levels before broader structure reassessment.
Nota
For countertrend trades, it's worth to wait for the market open, and we now have a H1 invalidation level at the H1 pivot (orange).Day trader capitalizing on the expansion phases of emerging trends.
MORE CHARTS & FREE EDUCATION
SUBSCRIBE 🚀 themarketflow.trading
MORE CHARTS & FREE EDUCATION
SUBSCRIBE 🚀 themarketflow.trading
Exención de responsabilidad
La información y las publicaciones que ofrecemos, no implican ni constituyen un asesoramiento financiero, ni de inversión, trading o cualquier otro tipo de consejo o recomendación emitida o respaldada por TradingView. Puede obtener información adicional en las Condiciones de uso.
Day trader capitalizing on the expansion phases of emerging trends.
MORE CHARTS & FREE EDUCATION
SUBSCRIBE 🚀 themarketflow.trading
MORE CHARTS & FREE EDUCATION
SUBSCRIBE 🚀 themarketflow.trading
Exención de responsabilidad
La información y las publicaciones que ofrecemos, no implican ni constituyen un asesoramiento financiero, ni de inversión, trading o cualquier otro tipo de consejo o recomendación emitida o respaldada por TradingView. Puede obtener información adicional en las Condiciones de uso.