$NDX Black Swan Correlation of Variance from 0% of $US10Y $US02Y
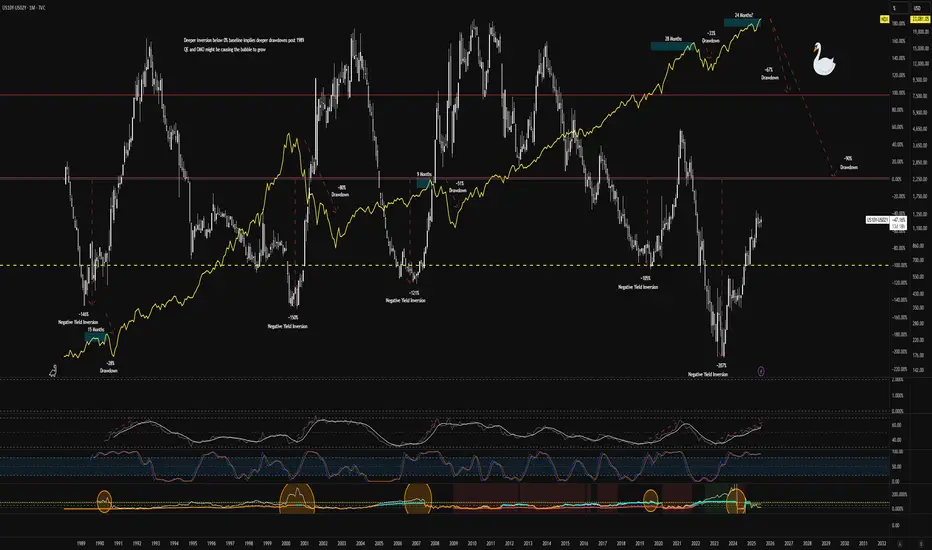
It appears that since 1989, deeper inversions of the yield curve have led to deeper drawdowns in the $NDX. Relative strength always appears to be in a steeper move upward coupled with fuzzy signals in volatility before the drawdown. Based on the previous market crashes, anything from a 60% to 90% drawdown appears to be plausible.
Currently buying long-expiry OTM put verticals across tech meme names (think PLTR) and potentially on some stalwart Mag7 tickers (maybe
  META) for pennies for potentially massive risk/reward paydays. Nothing more than a few grand, but I'm also long exposure to battery materials, hydrogen, and other energy plays.
  ABAT
ABAT  PLUG
PLUG  WWR
WWR  LAC
LAC  ENVX
ENVX  CHPT
CHPT  LEU
LEU  SMR
SMR
Best of luck.
Currently buying long-expiry OTM put verticals across tech meme names (think
Best of luck.
Exención de responsabilidad
La información y las publicaciones que ofrecemos, no implican ni constituyen un asesoramiento financiero, ni de inversión, trading o cualquier otro tipo de consejo o recomendación emitida o respaldada por TradingView. Puede obtener información adicional en las Condiciones de uso.