TTML – Elliott Wave Structure Suggests One More Leg Down Before
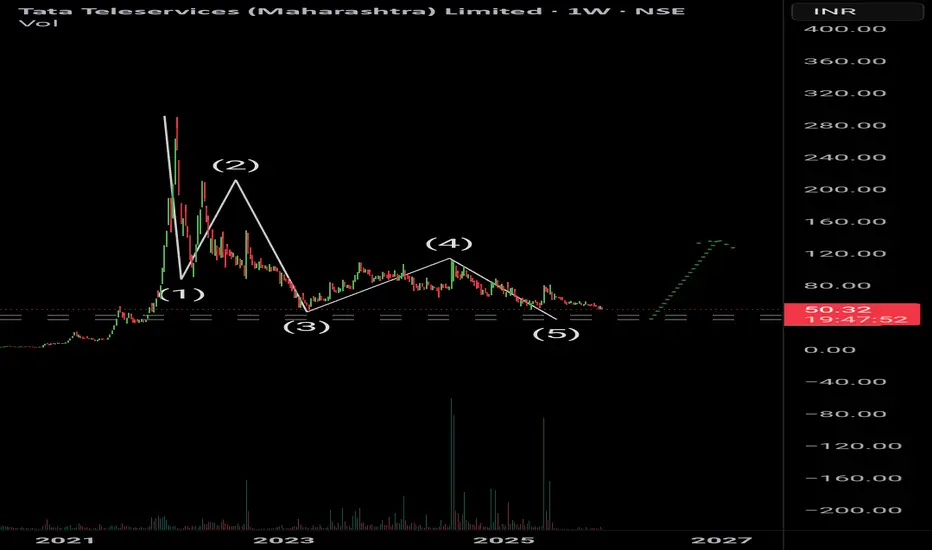
TTML has been consistently showing sell pressure on every bounce, indicating that the current downtrend is still in control. Based on the Elliott Wave count, the chart structure suggests that Wave (5) may not be fully complete yet.
The ongoing correction hints at more downside pain, with price likely to test the ₹40–₹38 support zone. This area aligns with multiple historical support levels and also fits well with the final leg of the Elliott Wave structure.
If the stock holds this demand zone, a strong reversal toward the ₹150–₹155 region becomes highly probable, marking a potential start of a larger bullish cycle.
Trading Plan (For Investors)
Accumulation Zone: ₹38 (±2)
Stop Loss: ₹35
Target: ₹155
Exención de responsabilidad
La información y las publicaciones no constituyen, ni deben considerarse como asesoramiento o recomendaciones financieras, de inversión, de trading o de otro tipo proporcionadas o respaldadas por TradingView. Más información en Condiciones de uso.
Exención de responsabilidad
La información y las publicaciones no constituyen, ni deben considerarse como asesoramiento o recomendaciones financieras, de inversión, de trading o de otro tipo proporcionadas o respaldadas por TradingView. Más información en Condiciones de uso.